Athlemetrics Predictor: Rating Is More Than a Number
Athlemetrics Predictor is a rating and role-profiling engine for real players and custom inputs (custom payloads). Built by Athlemetrics, it helps you screen quickly, break down ability structure, and use Role Clusters for style positioning and visual interpretation.
Learn more about the team on About Us, explore visuals in the media gallery, and review product options on Athlemetrics Plans.
For the second article in this Athlemetrics Predictor series, read Part 2 here.
Two misconceptions often appear when people read a player rating:
1. “Is this score the same as overall ability?”
2. “Can one score be compared across different positions?”
Athlemetrics Predictor is built to prevent these two misreadings.
The aim is an explainable, comparable, reusable season-performance profile built from
limited data and inconsistent definitions, and the Athlemetrics Predictor framework applies reliably to both real players and custom samples.
01 What can Athlemetrics Predictor do for you?
Athlemetrics Predictor is not built to output a single score for an “absolute ranking.” The Athlemetrics Predictor goal is actionable decision information: fast performance screening, clearer ability breakdowns, role-style identification, and outputs you can plug into reports, comparisons, and downstream modeling.
If your workflows include data ingestion, the football API posts and the Athlemetrics API documentation show how to connect ratings to your internal pipelines.
Use the Overall Rating to quickly gauge season performance and compare within the same role group in the Athlemetrics Predictor output.
- Output: Overall Rating plus role group and basic context (season, league, team, minutes).
- Use cases: pool filtering, recruitment shortlists, and quick benchmarking within the same league and role.
- Interpretation: the score reflects season performance strength, not a direct proxy for talent or ceiling.
Go beyond the total score and use sub-dimension ratings to separate output-led, creative, and defensive strengths.
- Output: Attack / Creation / Defense / Universal (GK includes GK Save).
- Use cases: explain why scores are high/low and locate functional roles or gaps in a system.
- Advantage: players with the same overall can show clear style differences via sub-dimensions.
Use the Role Cluster to project players into a style space so you see not only how strong, but what type they resemble.
- Output: Role Cluster label and style coordinates for visualization and similar-player search.
- Use cases: role matching, squad building, and replacement search via nearest neighbors.
- Interpretation: focuses on responsibilities and playing style rather than rigid position names.
With only a few key metrics (minutes, goals/xG, assists, etc.), Athlemetrics Predictor can still output ratings and role profiles for incomplete inputs.
- Output: rating pack (Overall + sub-dimensions), role group suggestion, and role cluster prediction.
- Use cases: players without full tracking data, academy samples, or custom “ideal player” comparisons.
- Mechanism: the system fills essential context features so the input space matches real players.
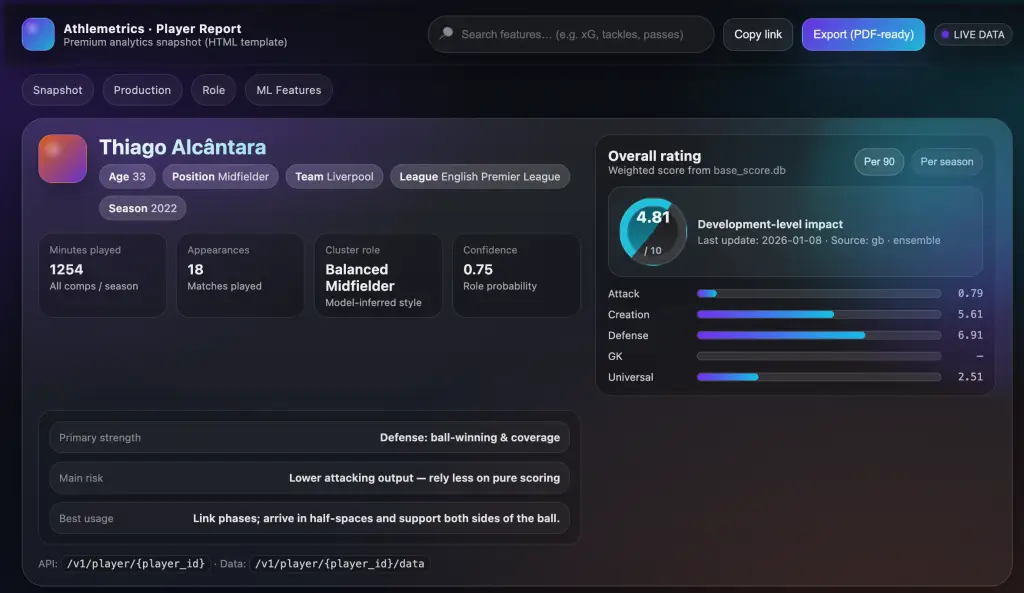
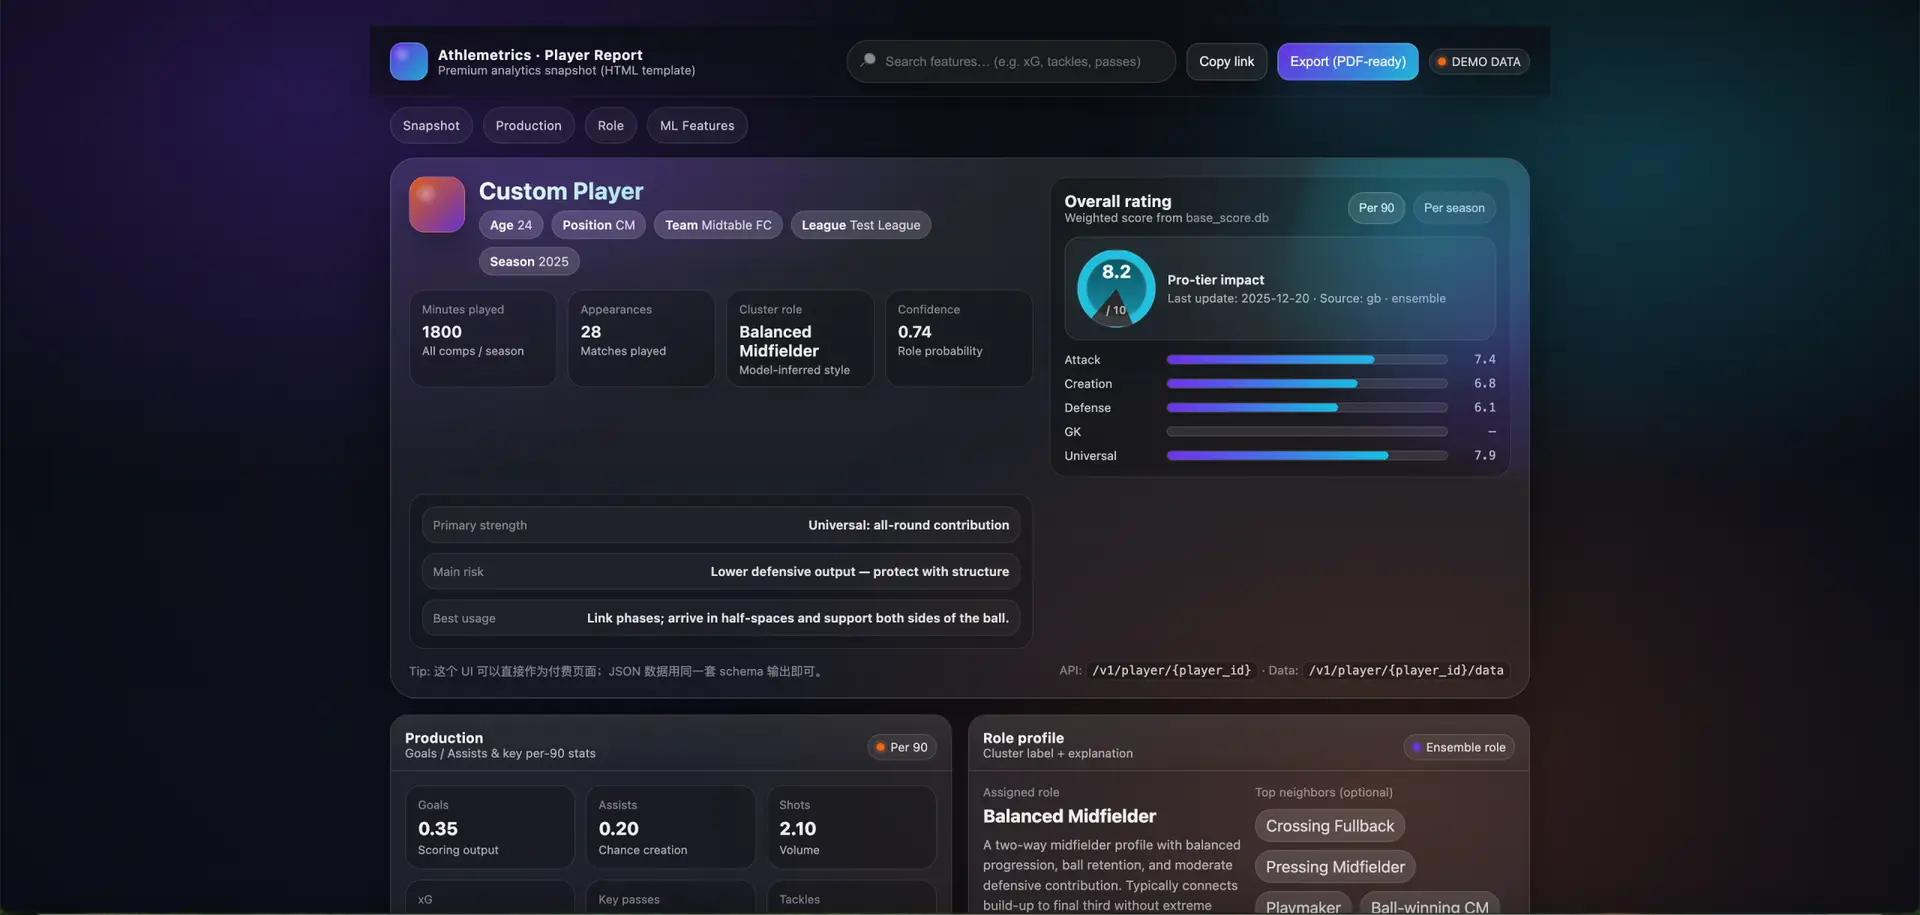
Athlemetrics Predictor deliverables overview (Output Pack)
Athlemetrics Predictor Output Pack
The report deliverables (HTML/PDF) are the main presentation, paired with a structured rating and role profile data pack.
HTML report preview
Web-ready | Embeddable | Interactive-ready
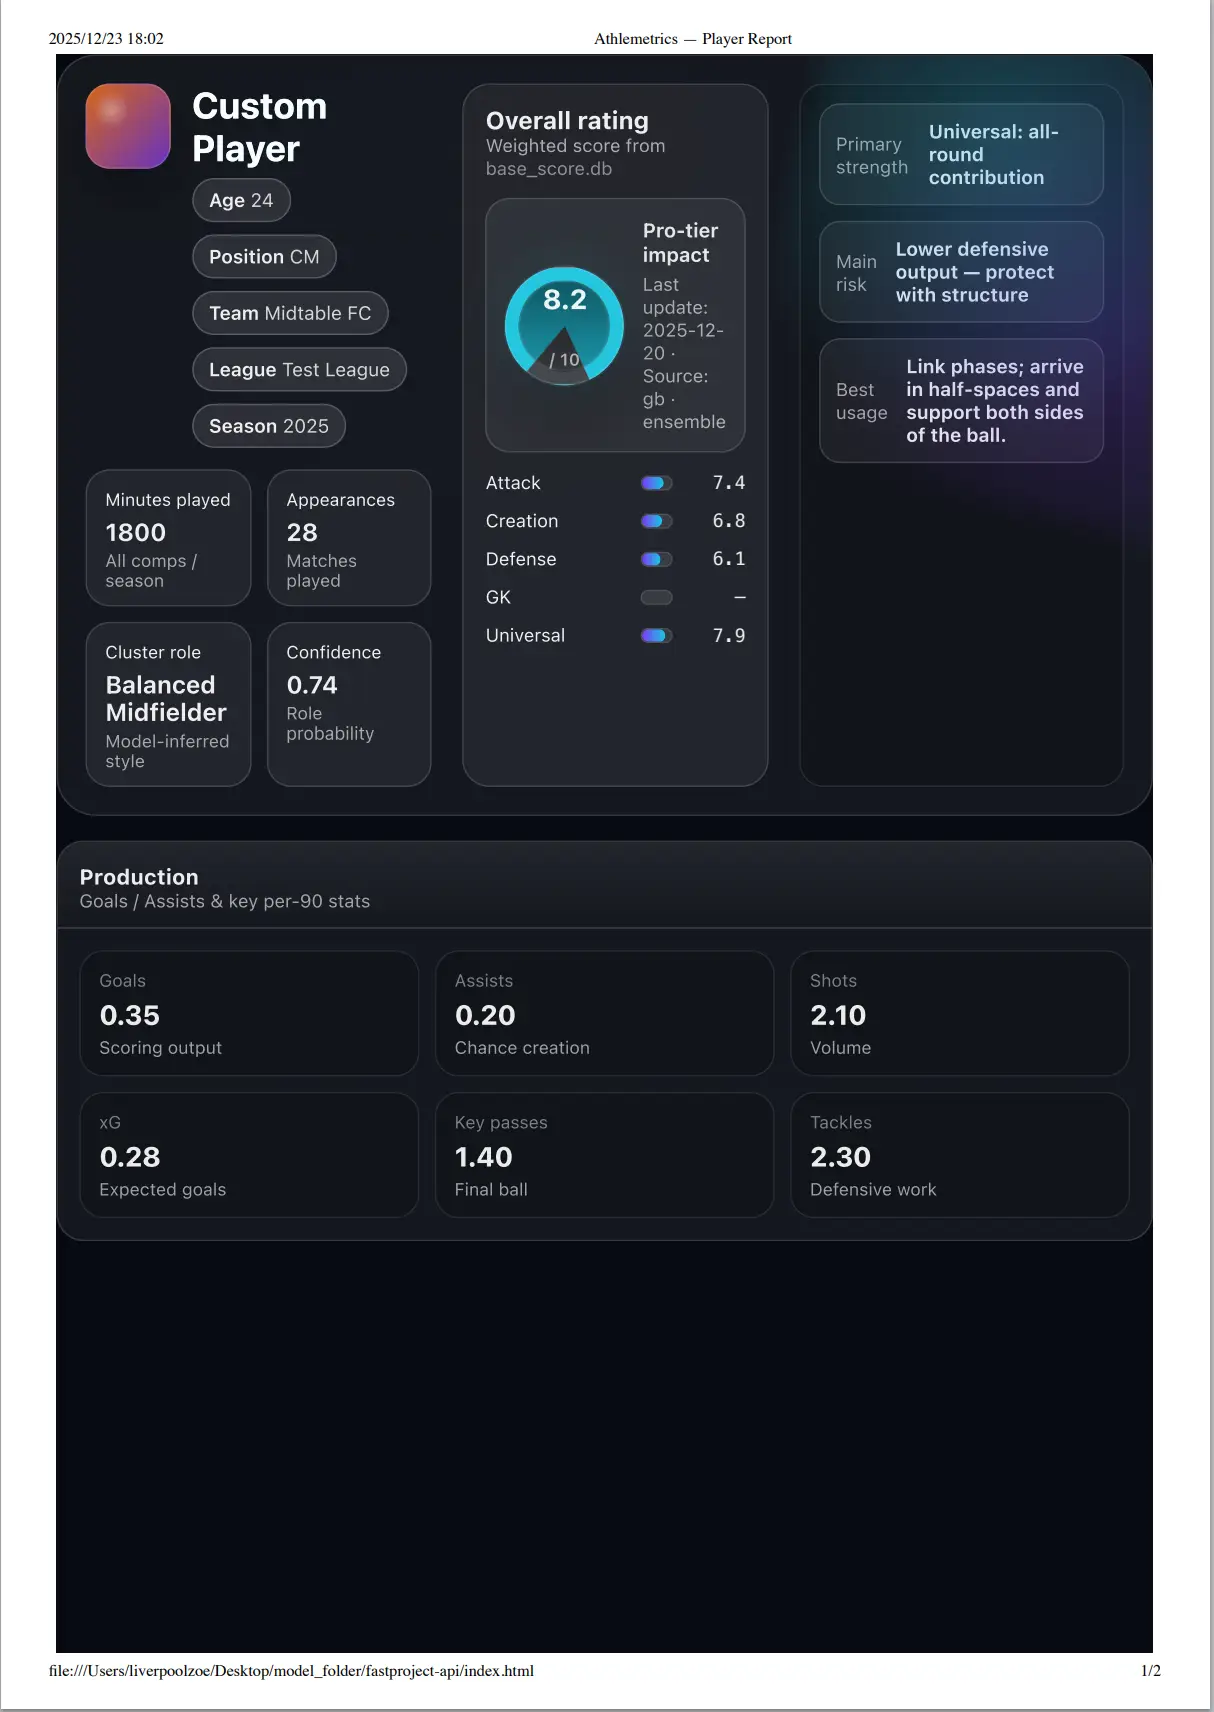
PDF export
Print-ready | Share-friendly | Archive-consistent
Beyond the report deliverables, Athlemetrics Predictor also outputs a structured data pack for comparisons, secondary visualizations, or integration into your own product workflows.
Rating Package
- Overall Rating: used for rapid screening and ranking within the same role group.
- Sub-dimension ratings: Attack / Creation / Defense / Universal (GK includes GK Save).
- Base context: season, league, team, minutes, and key stat definitions for interpretation and review.
Role Profile
- Role Group: Attacker / Midfielder / Defender / Goalkeeper.
- Role Cluster: style and responsibility grouping for style maps and similar-player search.
- Explainable Context: minutes reliability adjustment, league strength, and context features to align results with real match environments.
02 Athlemetrics Predictor core value: from raw data to actionable insight
Collecting data is only step one; the real challenge is interpretation. Raw statistics are noisy: differences in minutes, league strength, and tactical roles can make identical numbers mean very different things. Athlemetrics Predictor standardizes this context so ratings stay comparable.
Athlemetrics Predictor is not designed to replace expert judgment. It acts as a standardized middleware layer that addresses two core pain points when raw data is used for decisions: missing context and engineering complexity.
The hardest part of football analysis is true apple-to-apple comparison. The model removes confounding variables so analysts can focus on ability itself.
- Noise reduction: automatically adjusts minutes (minutes scaling) and league coefficients so subs or lower tiers do not inflate numbers.
- Role alignment: aligns evaluation dimensions with responsibilities; for example, it does not use goals to judge a defensive midfielder.
- Baseline: supplies an objective reference score from full-sample statistics to help scouts validate subjective observations.
Normalizing, weighting, and imputing hundreds of features is tedious and error-prone. We wrap this logic into reusable components.
- Feature kits: even if the frontend provides only a few fields, the feature assembler completes the input vector via interpolation.
- Decoupled maintenance: rating rule changes (e.g., league weights) update in the model layer without touching application code.
- Cold-start support: for custom players with limited history, the model uses cluster defaults to generate a reasonable estimated profile.
We do not promise to predict the future; we provide a high-precision summary of the past. By automating cleaning and weighting, analysts can move from spreadsheet wrangling to real tactical analysis and decisions.
03 Athlemetrics Predictor algorithm deep dive: how is the rating computed?
Athlemetrics Predictor is built as an explainable rule system with a consistent calculation schema that outputs structured results. The workflow can be cleanly summarized in three steps:
Standardization: put data on the same ruler
Raw data (shots, pass accuracy, yellow cards) live on different scales and cannot be added directly.
We first compute the Z-Score (Standardized Feature) for each metric and convert it into
a relative performance value.
Interpretation: higher values indicate stronger performance within the peer group.
Modularization: build ability facets
The overall rating is not a black box; Athlemetrics Predictor decomposes it into five core modules:
Within each module, we handle positive and negative indicators (e.g., fouls, mistakes) so all scores point the same way: higher is better.
Role weighting: make the important more important
This is the key step. Modules are weighted based on the player’s Role Group.
For example, Attack carries a high weight for forwards, while Creation is higher for midfielders. This keeps Athlemetrics Predictor from evaluating a winger with the goalkeeper’s ruler.
04 Athlemetrics Predictor results validation: accuracy and distribution checks
We benchmarked Gradient Boosting (GB) against Ridge regression. The GB model performed exceptionally: test R2 reached 0.97, stayed stable across 5-fold cross-validation, and showed no signs of overfitting for Athlemetrics Predictor.
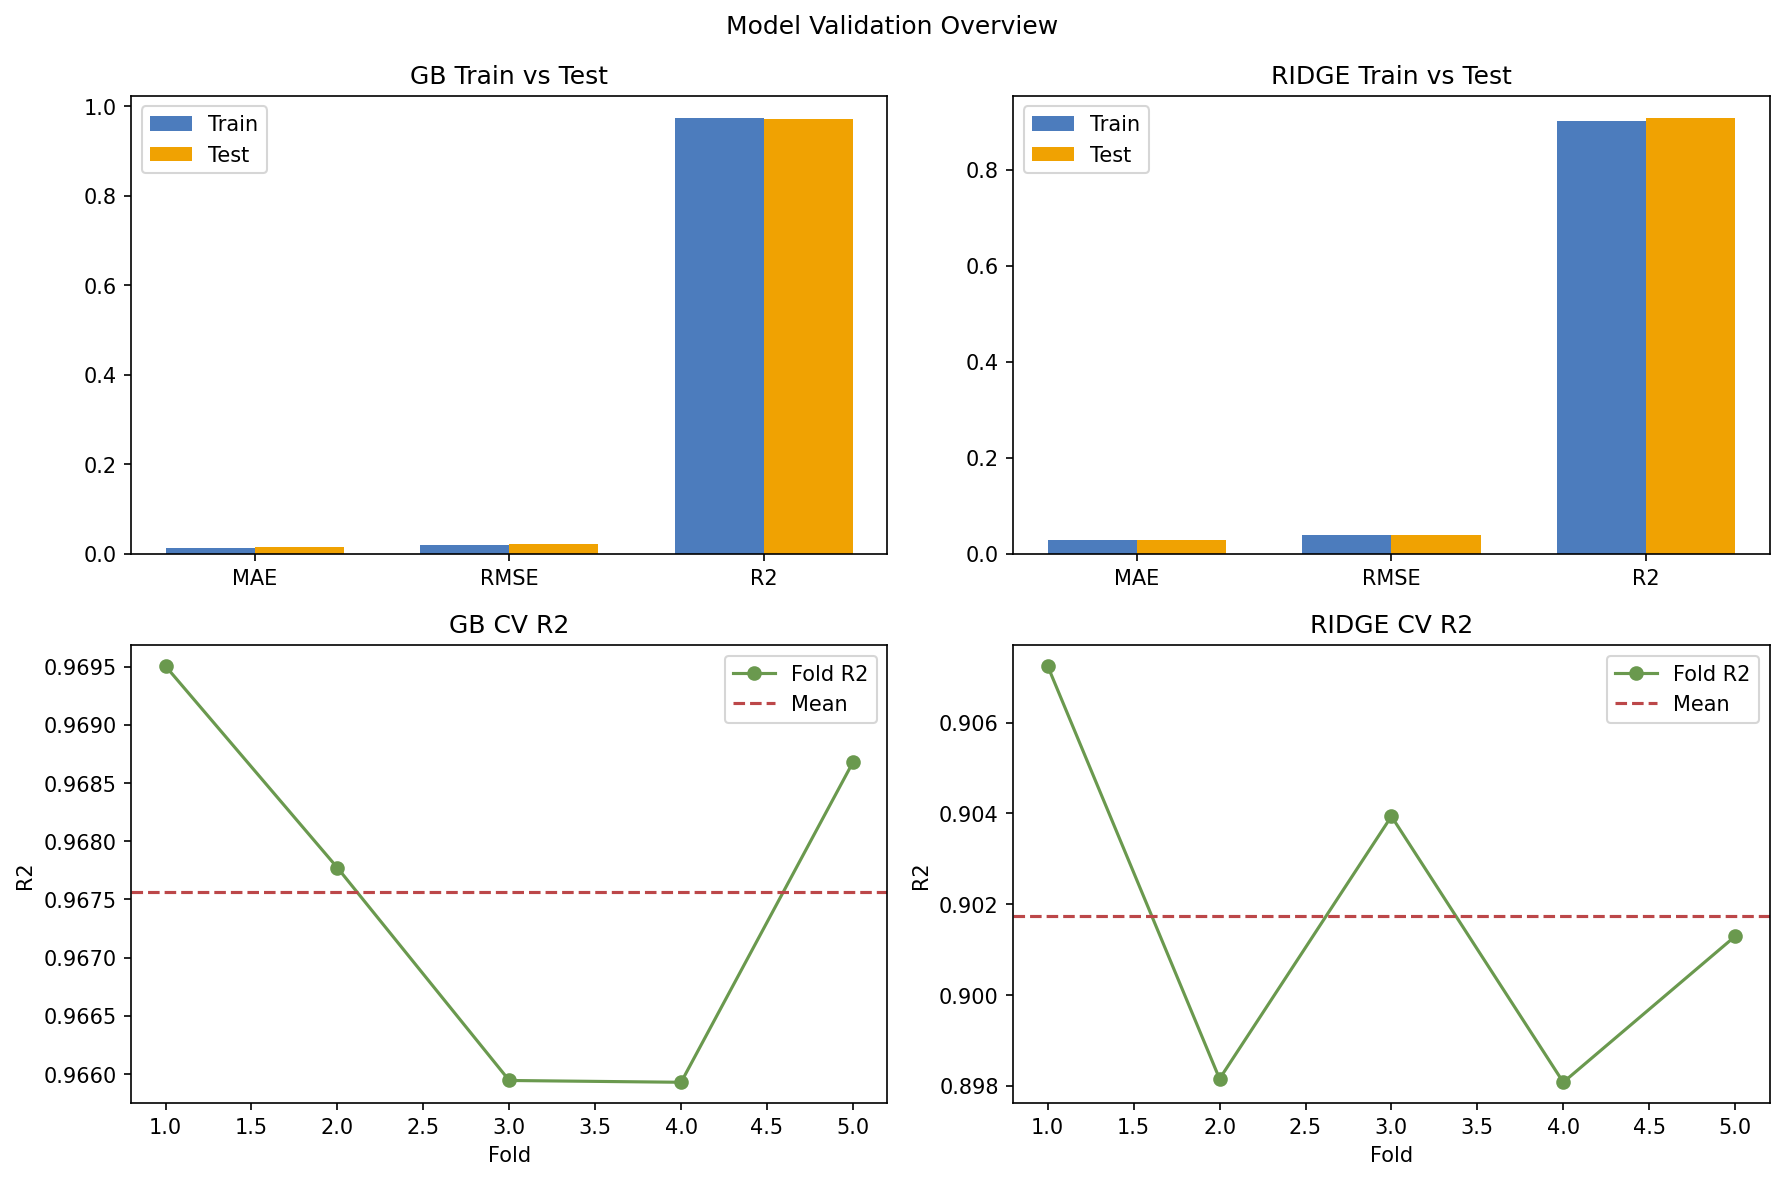
*Chart: the GB model performs consistently on train and test, demonstrating robustness.
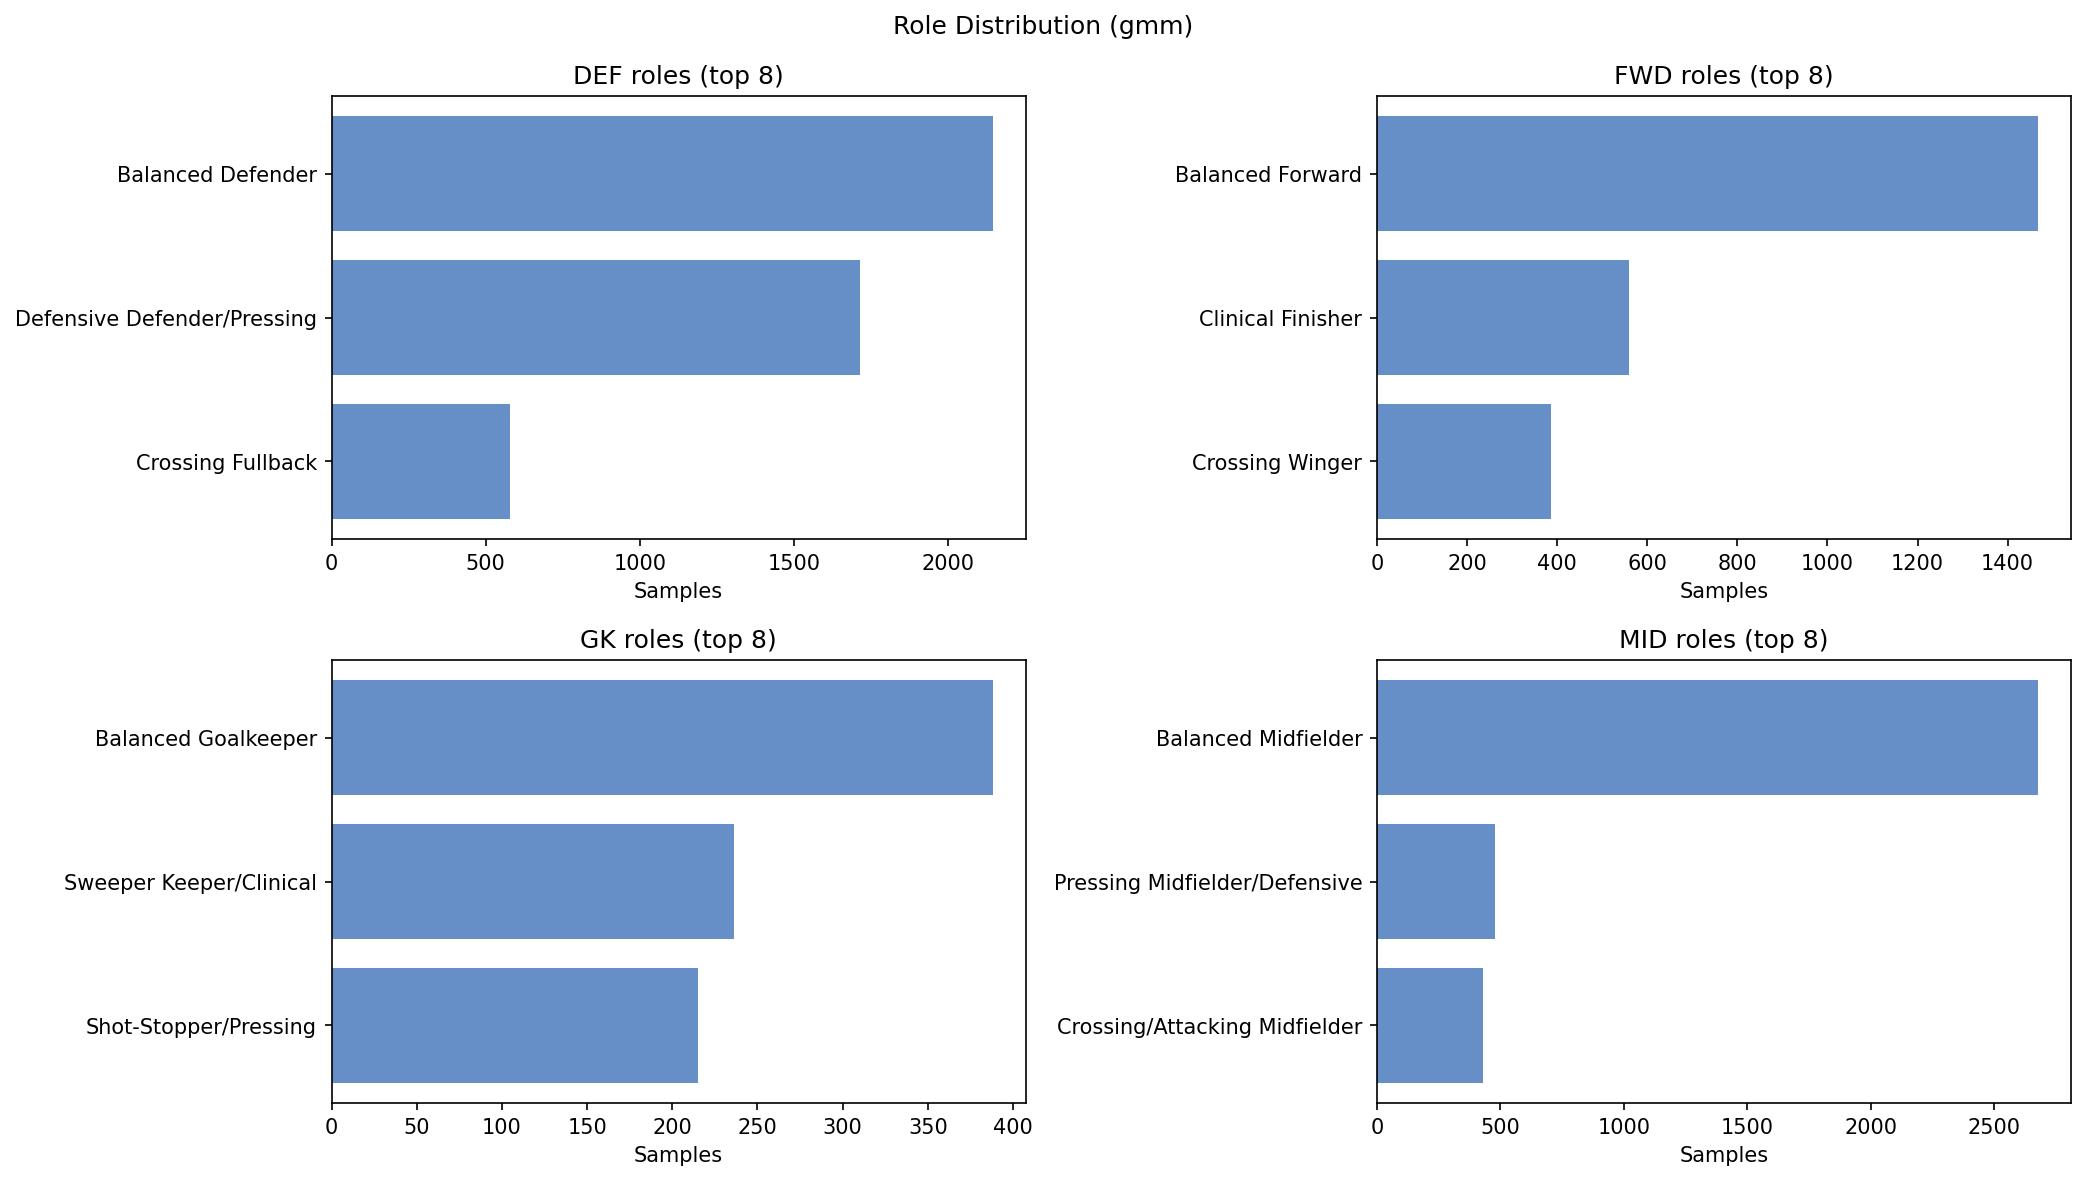
We use a Gaussian Mixture Model (GMM) to cluster players in an unsupervised way and automatically identify real tactical roles (e.g., “finisher,” “crossing fullback”). This keeps the rating system anchored to actual on-pitch function, not rigid position labels.
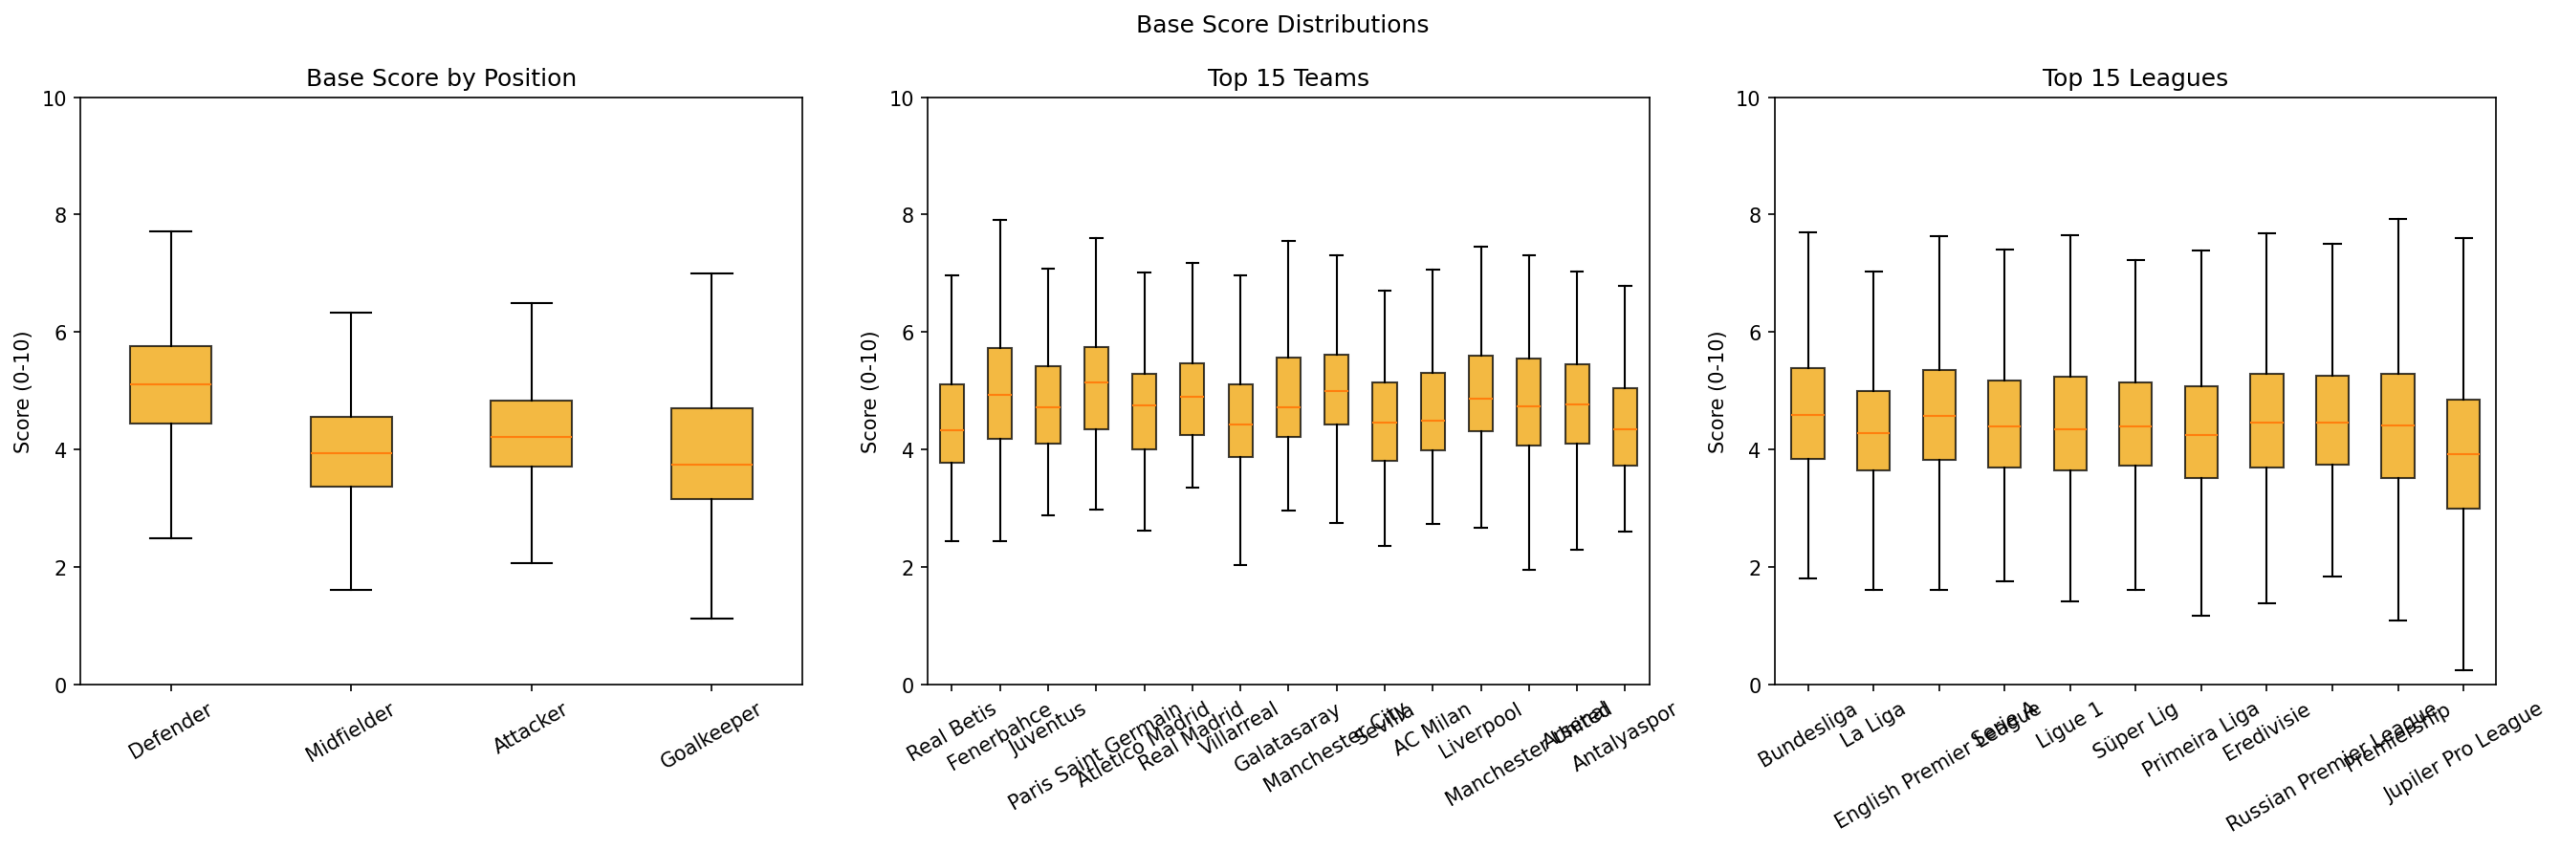
We ran box-plot checks across the top 15 leagues and elite clubs. Medians by position sit in a stable 4-5 range, and distributions align between elite teams and top leagues, demonstrating cross-league generality.
For engineering teams and data scientists, the snippets below show core Python implementation logic, including how Athlemetrics Predictor handles edge cases and data cleaning.
For a broader product overview, browse the Athlemetrics Plans page and the About Us background.
Minutes Scaling
Logistic smoothing for per90 stability
def minutes_penalty_factor(minutes_z, positions):
    # Apply logistic curve to dampen low minutes
    logistic = 1.0 / (1.0 + np.exp(-(mins - CENTER) / SCALE))
    factor = FLOOR + (1.0 - FLOOR) * logistic

    # Normalize by role group to preserve distribution
    mean_by_role = factor.groupby(pos).transform("mean")

    return (factor / mean_by_role).clip(lower=FLOOR)
Hybrid Weighting
Critic + Entropy calculation
def hybrid_weights(data, features):
    c_weights = critic_weights(data, features)
    e_weights = entropy_weights(data, features)

    # Combine distinction (Critic) & info gain (Entropy)
    combined = {
        f: ALPHA * c_weights[f] + (1 - ALPHA) * e_weights[f]
        for f in features
    }

    return normalize_to_sum_one(combined)
Group-Aware Split
Prevents player identity leakage
# Ensure same player (different seasons)
# never appears in both Train and Test
gss = GroupShuffleSplit(n_splits=1, test_size=0.2)

train_idx, test_idx = next(gss.split(X, y, groups=player_ids))

# Use GroupKFold for internal CV
cv = GroupKFold(n_splits=5)
Context Derivation
For custom/partial inputs
def derive_context(df):
    # Infer tactical context from limited data
    df["usage_rate"] = clip(minutes / 2700.0, 0, 1)

    # Progress vs Safety ratio
    df["directness"] = (prog_pass + carry) - passes / 50.0

    # Estimate possession dominance
    df["possession_proxy"] = passes / (passes + duels)
    return df
Summary: what do you ultimately get from Athlemetrics Predictor?
To make results not only readable but usable, the final Athlemetrics Predictor output pack includes:
- Ratings: Overall Rating and the four sub-dimension scores.
- Style positioning: Role Cluster (e.g., “power striker” or “false nine”).
- Context: a composite profile weighted by league strength and minutes.
Final advice:
Avoid fixating on a single total score. The rating reflects average season performance.
The right approach is to read it alongside sub-scores. If a player has a modest overall but very high Creation,
he may be a distinctive, system-specific profile. Athlemetrics Predictor is built to make those
trade-offs visible in a consistent, role-aware format.
Part 2 | Traditional Ratings vs Athlemetrics Predictor: What’s the real difference?
Most “player ratings” fall into three buckets: game ratings (e.g., FIFA), media/data platform ratings (e.g., WhoScored / SofaScore / Opta), and social or fan vote ratings. Each offers a useful reference, but their purposes differ, which is why the same player can look inconsistent across systems. This section is the second article in the Athlemetrics Predictor series; the full Part 2 article lives at Athlemetrics Predictor: Rating Is More Than a Number (Part 2).
FIFA’s Overall is tied to core attributes and player reputation. It works for long-term ability impressions rather than rigorous decision-making.
- Strength: low communication cost, good for coarse impressions.
- Limitation: updates lag and do not explain details.
Based on in-match event data and updated in real time. It reads like a single-match summary, is often sensitive to attacking actions, and frequently underweights defensive value.
- Strength: scalable, quick numeric summary.
- Limitation: emphasizes volume over quality; defense is often undervalued.
Reflects audience sentiment and heat, heavily influenced by results and narratives. It suits content distribution rather than rigorous evaluation.
- Strength: high virality and captures public perception.
- Limitation: highly subjective and hard to audit.
What makes Athlemetrics Predictor different: built for decisions and deliverables
Athlemetrics Predictor is not positioned to replace these systems. Instead, it turns ratings into an explainable, reusable, deliverable workflow: you get not just a number, but a structured “why” and outputs that can be used directly for reporting or integration. That is the core product philosophy at Athlemetrics.
If you want to see more examples and visual assets, visit the Athlemetrics gallery.
Ratings are compared within role groups (Attacker/Defender, etc.), reducing misreads across responsibilities.
Outputs include Attack / Creation / Defense / GK Save sub-dimensions, turning score debates into structure discussions.
Supports HTML/PDF/JSON outputs for direct integration into scouting reports or internal workflows.
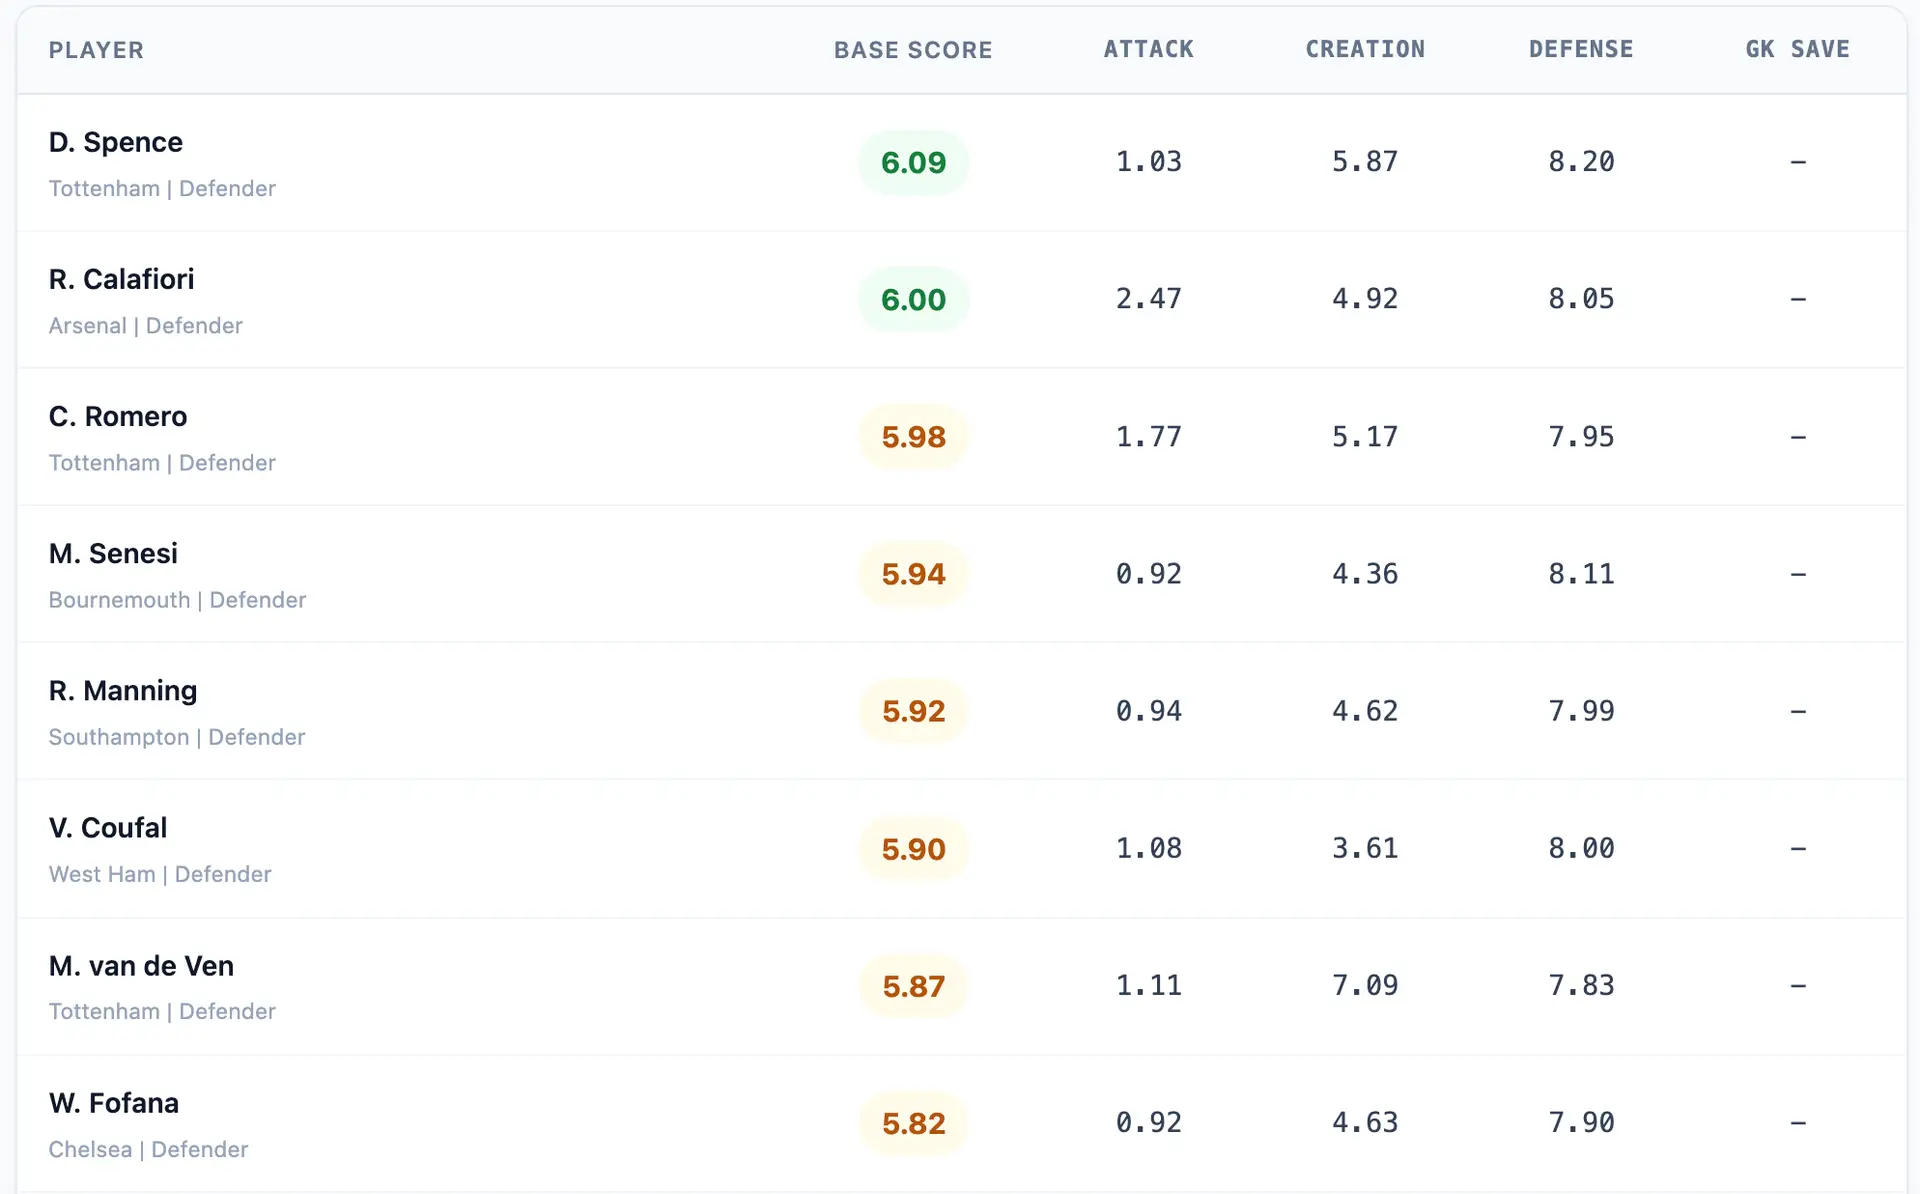
Athlemetrics Predictor EPL 24/25 Season – Model Output Preview
*The data below shows a real sample of model outputs (Top 20), sorted by Base Score.