Rating Model · Evaluation
Regression model evaluation and interpretability: generalization, error analysis, feature importance, and role-level comparisons (charts from assets/img/base_score/).
Overall Performance
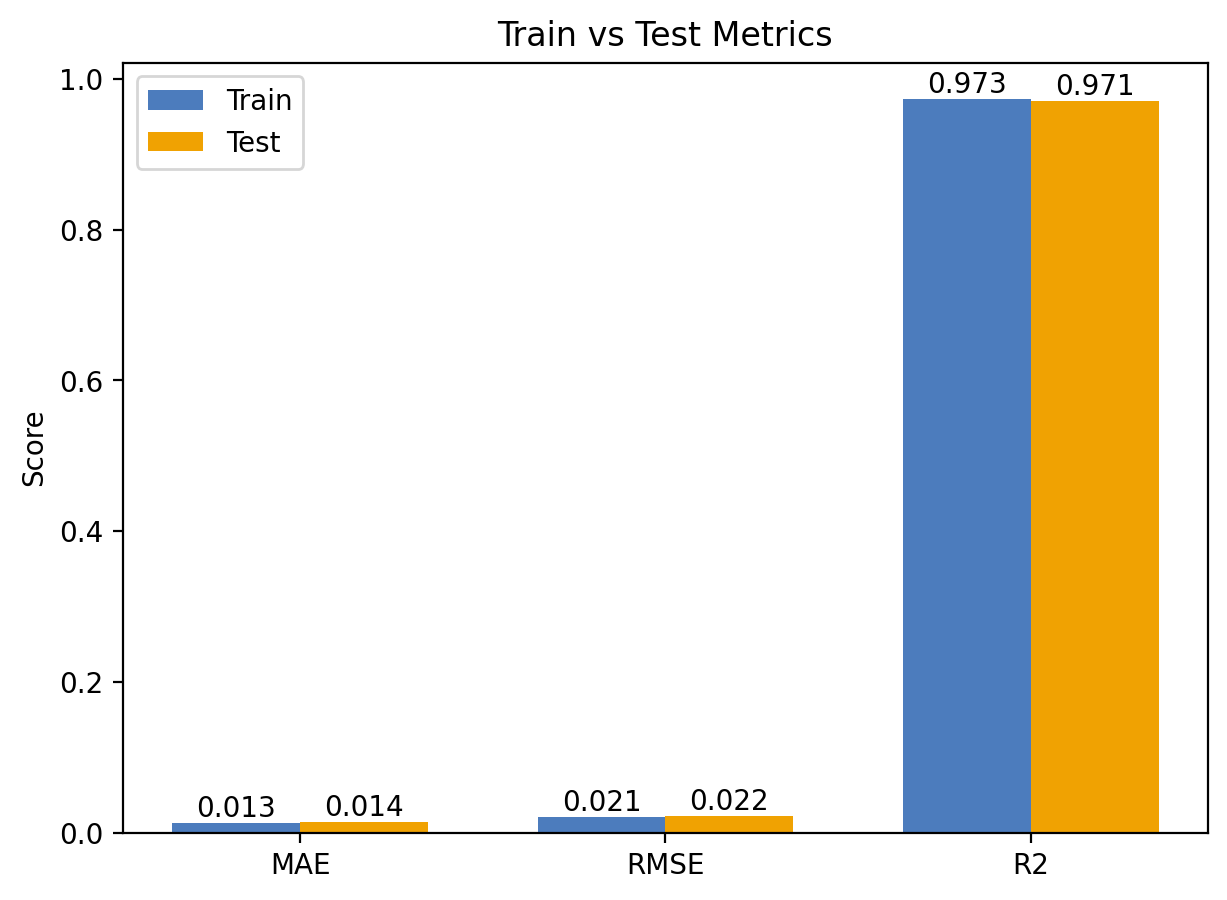
Train vs. Test Metrics
Indicates strong generalization with low overfitting risk.
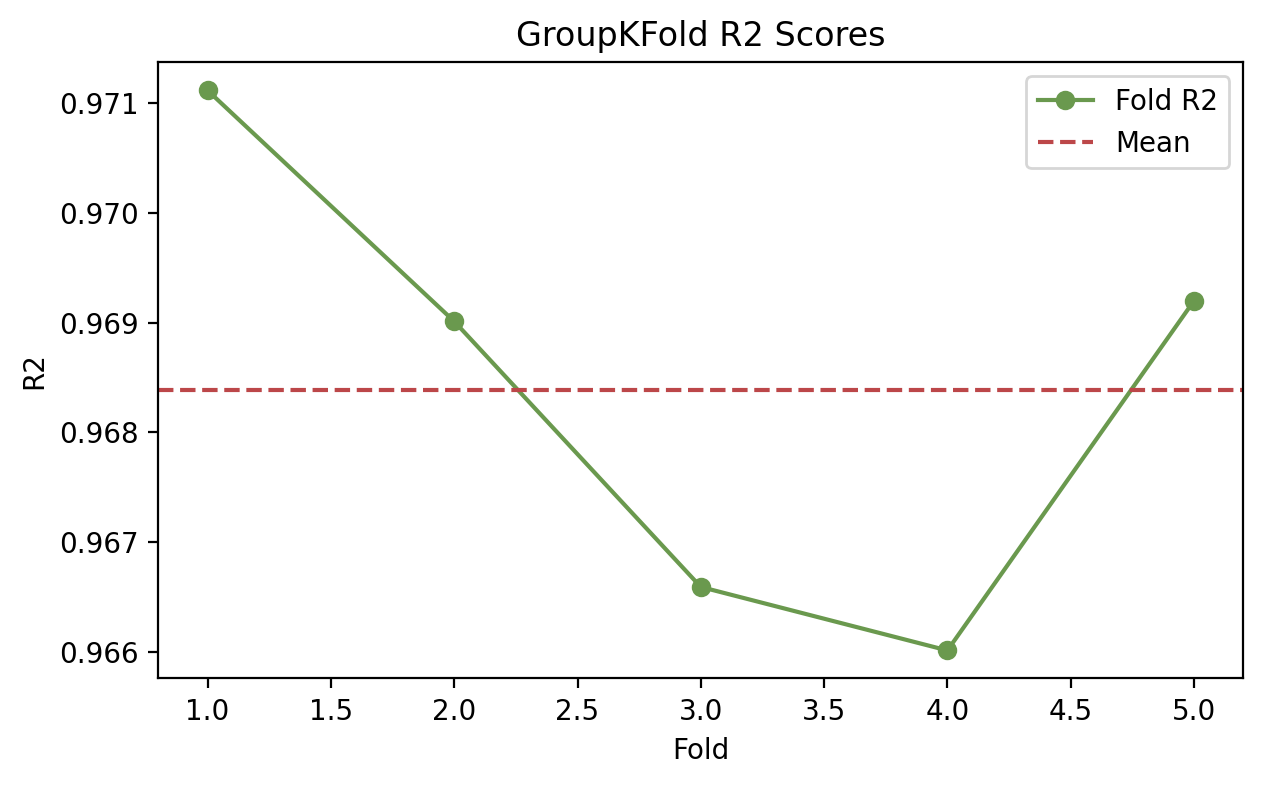
Cross-Validation Stability
Robust to season/team grouping, closer to real-world deployment.
Seasonal Trend Fit

Useful for cross-season comparison, anomaly spotting, and storytelling.
Accuracy & Error Analysis
Predicted vs. Actual
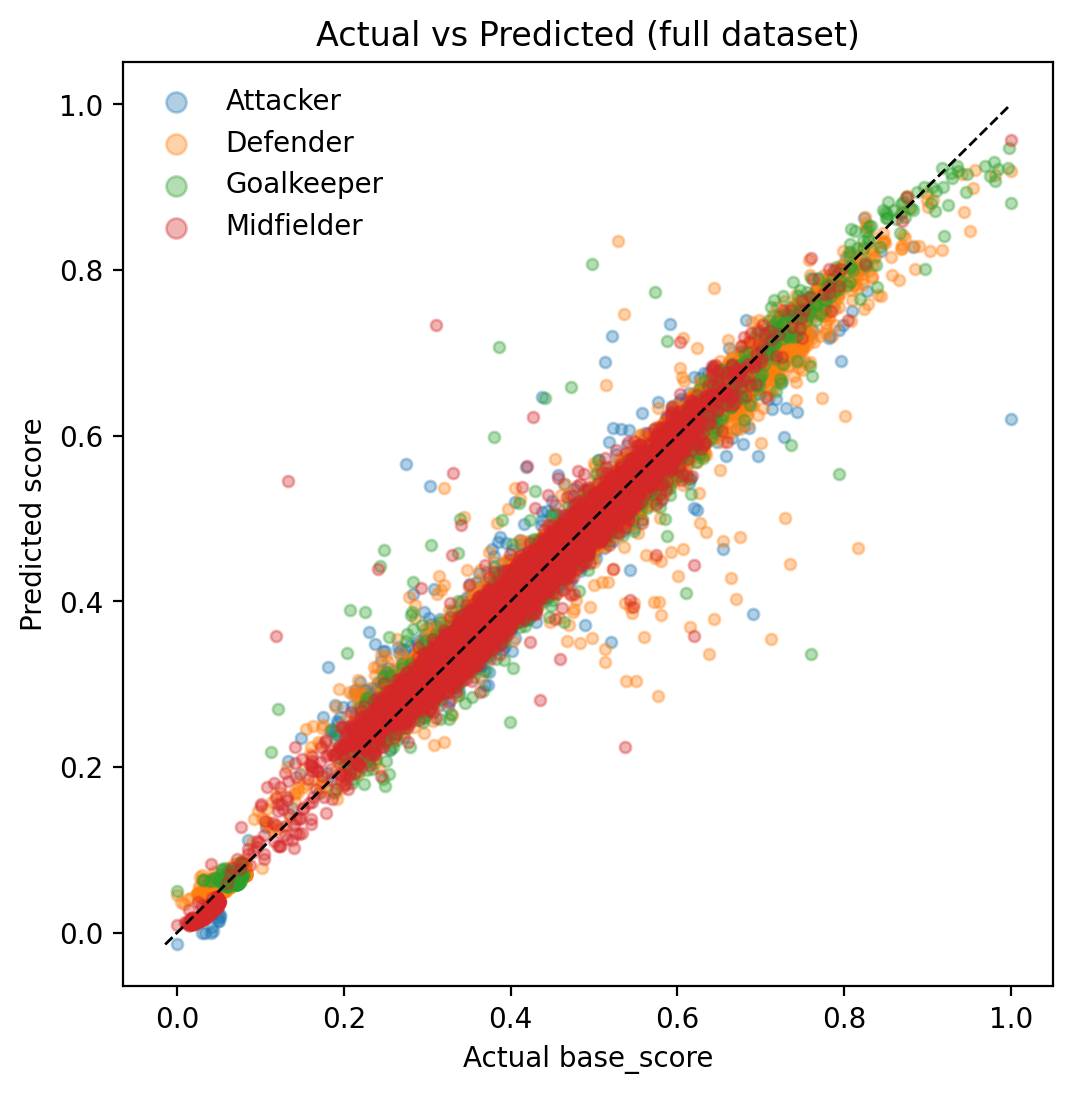
High accuracy with no obvious systematic bias across roles/positions.
Residual Distribution
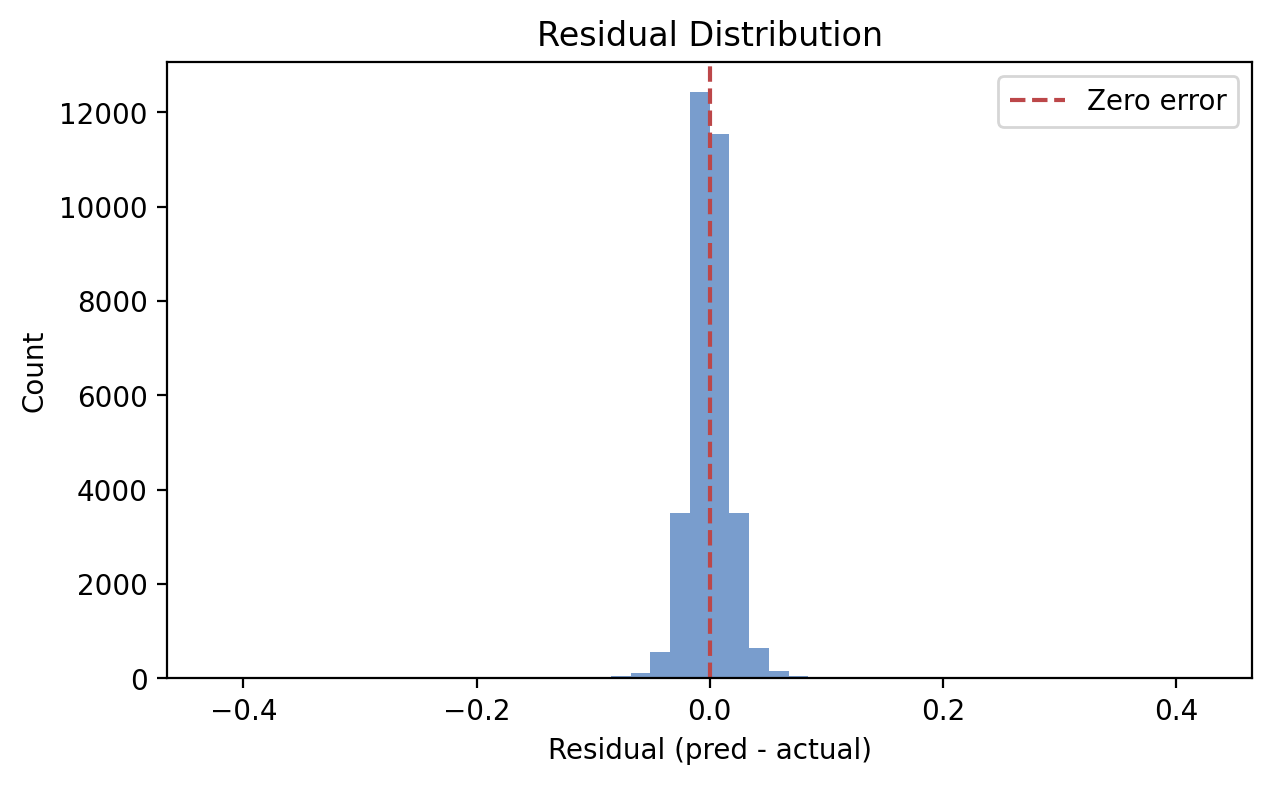
Residuals are centered near zero, suggesting low statistical bias.
Residuals by Role
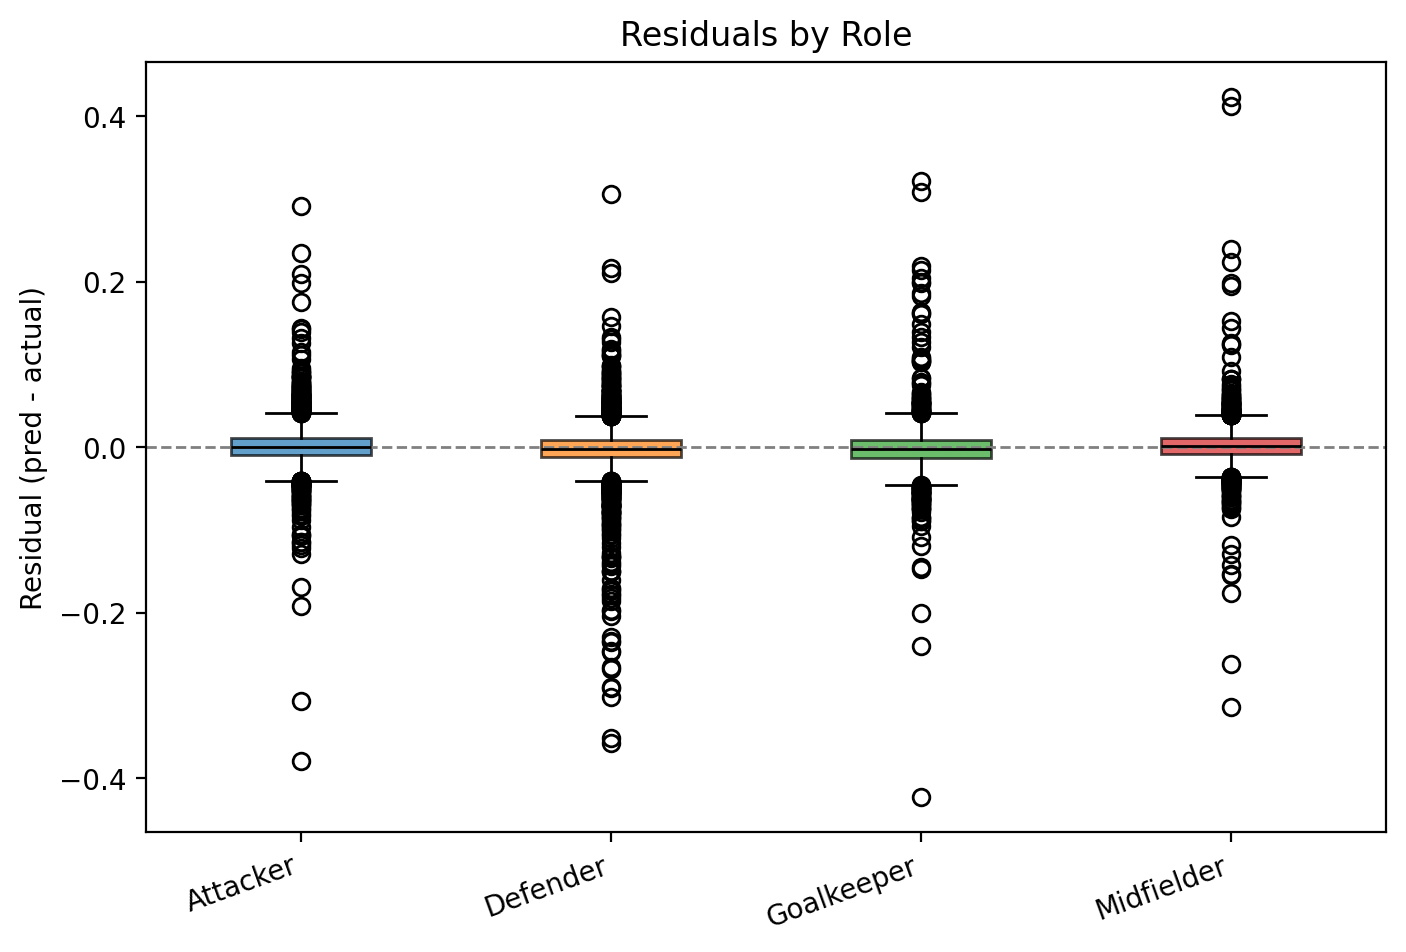
Operationally fair: no role is systematically favored or penalized.
Feature & Role Insights
Score Distributions
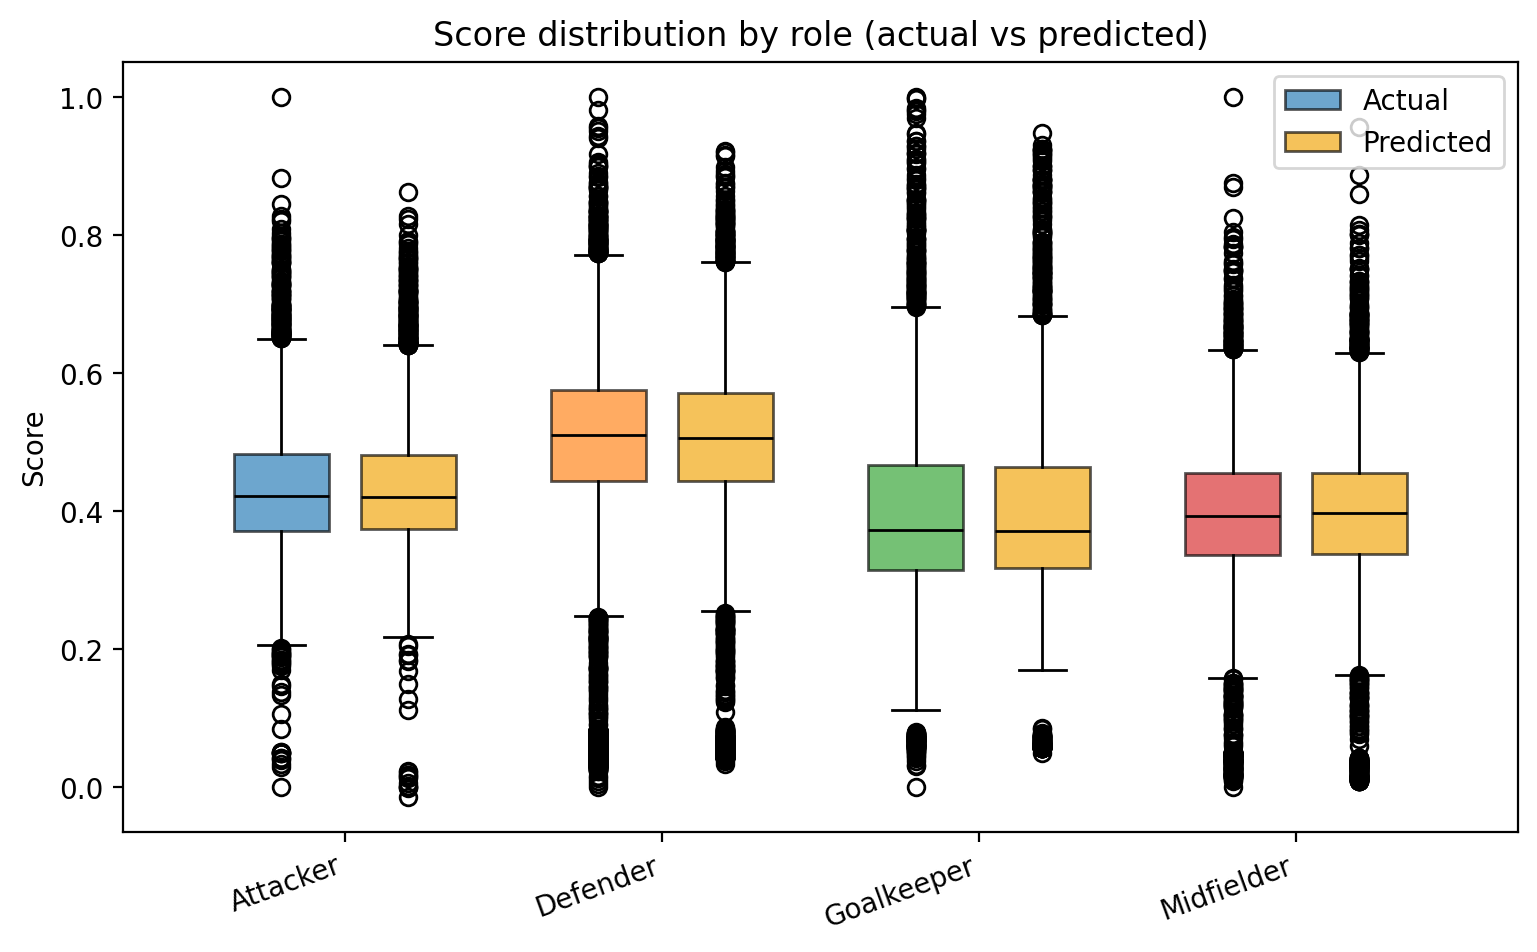
Supports both within-role comparison and cross-role interpretation.
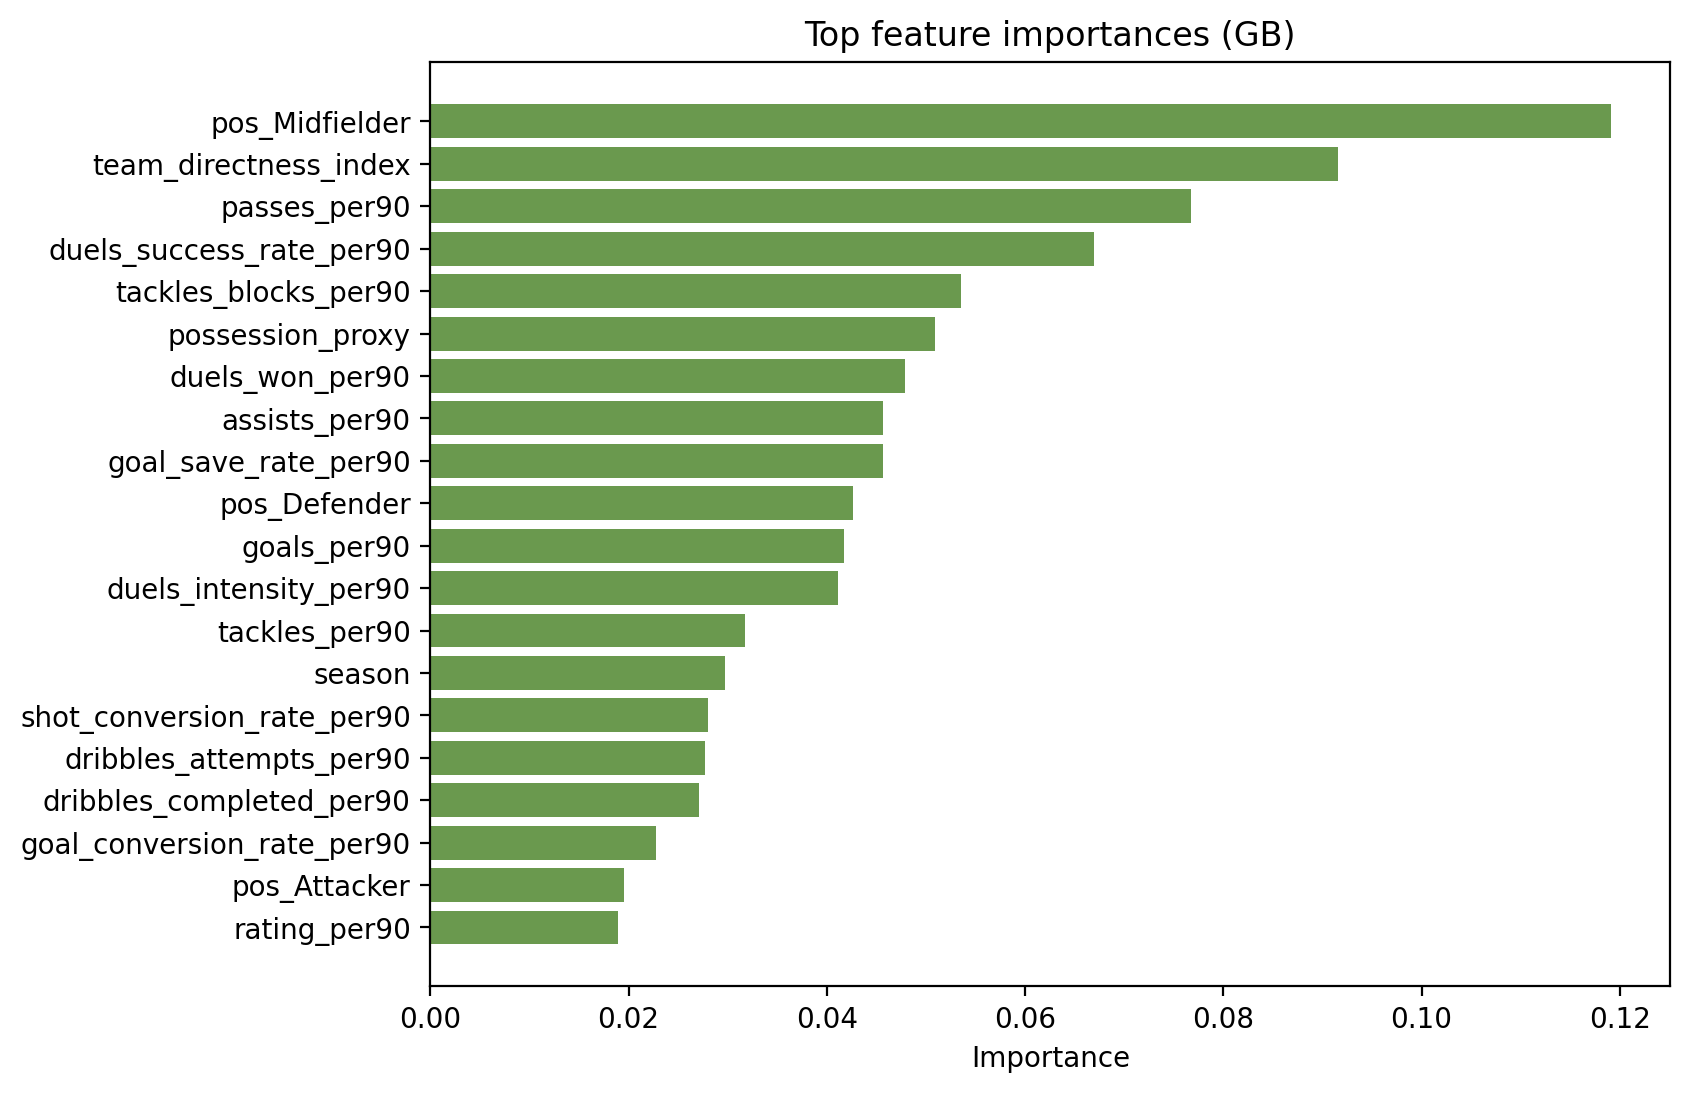
Feature Importance
Combine with show_features to explain why a score is assigned.
Score Bounds
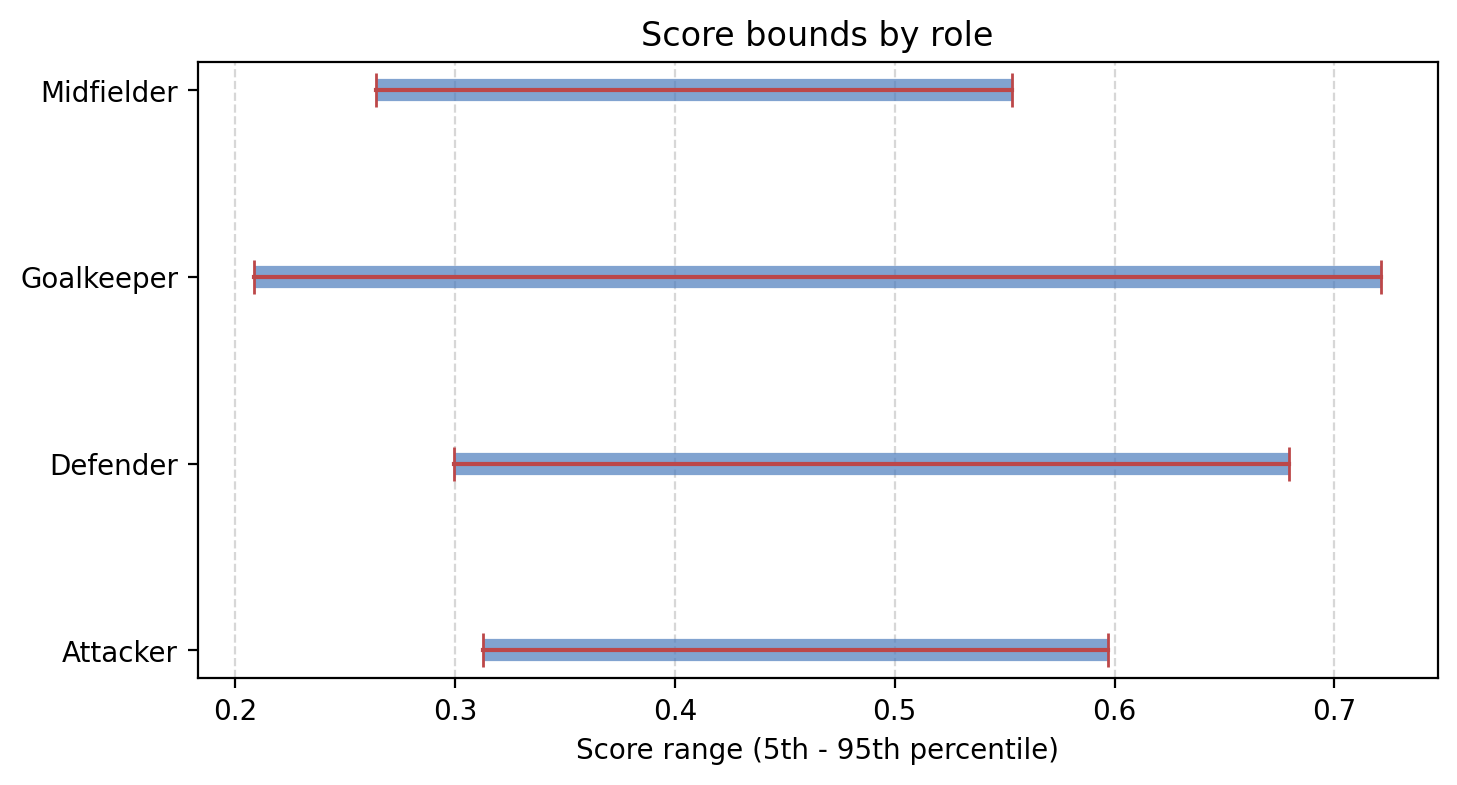
Useful for outlier detection and communicating floor/ceiling expectations.