Athlemetrics Predictor Framework & User Paths
← Read Part 1: Athlemetrics Predictor Rating is More Than a Number
Athlemetrics Predictor isn’t “just a rating endpoint.” It’s a comprehensive player-evaluation pipeline designed around comparability and deliverability. With Athlemetrics Predictor, season records from different data sources and statistical definitions can be interpreted on the same scale, compared side by side, and ultimately packaged into a more readable report. In this post, you’ll get a product-style overview of what each module solves, where its boundaries are, and where different types of users typically start.
Learn more on About Us, review Athlemetrics Plans, and browse the media gallery.
Think of the Athlemetrics Predictor as a path from “season data” to “readable deliverables”:
first align how the data is expressed, then score within a consistent group scale, and finally explain the results with roles and reports.
How the modules connect:
1) Calculator: converts totals / varying field formats into a unified schema (often per-90 and standardized payloads)
2) Prediction: produces an Overall score plus sub-scores for comparison and shortlisting
3) Database: retrieves stored season records and ready-made results (fast lookup)
4) Player Role + UI/Report: adds playstyle interpretation and packages results into readable pages and snapshots
01 Who the Athlemetrics Predictor Is For: Value Chain and the Shortest Path
When the goal is bulk comparison and shortlisting, what matters most is controllable inputs, interpretable score ranges, and clear boundaries.
- Focus: within-group comparability, sample thresholds, and uncertainty from missing fields.
- Typical value: moving evaluation from gut feel to repeatable, side-by-side comparisons.
If you’re embedding evaluation into a product, the core is a stable data contract and reusable presentation templates.
- Focus: structured outputs, version stability, and embeddable HTML/JSON deliverables.
- Typical value: turning evaluation results into modules you can integrate directly.
If you need both “how good” and “how they play,” scores and role profiles should be used together.
- Focus: strength comparison plus type explanation (similar-player lookup and differences).
- Typical value: reducing misreads caused by “same position, different responsibilities.”
When the goal is fast understanding and sharing, the key is translating structured data into a readable page.
- Focus: readability, visualization, and shareability (a link that reproduces the view).
- Typical value: understanding season performance on a consistent scale, instead of piling up stats.
If you treat Athlemetrics as an “evaluation production line,” a simple flow chart answers two things: where the data comes from and why normalization is necessary, and what form the results are delivered in. You don’t need to memorize every endpoint name, just follow the three-stage logic: “normalize inputs → score on a scale → explain and present.”
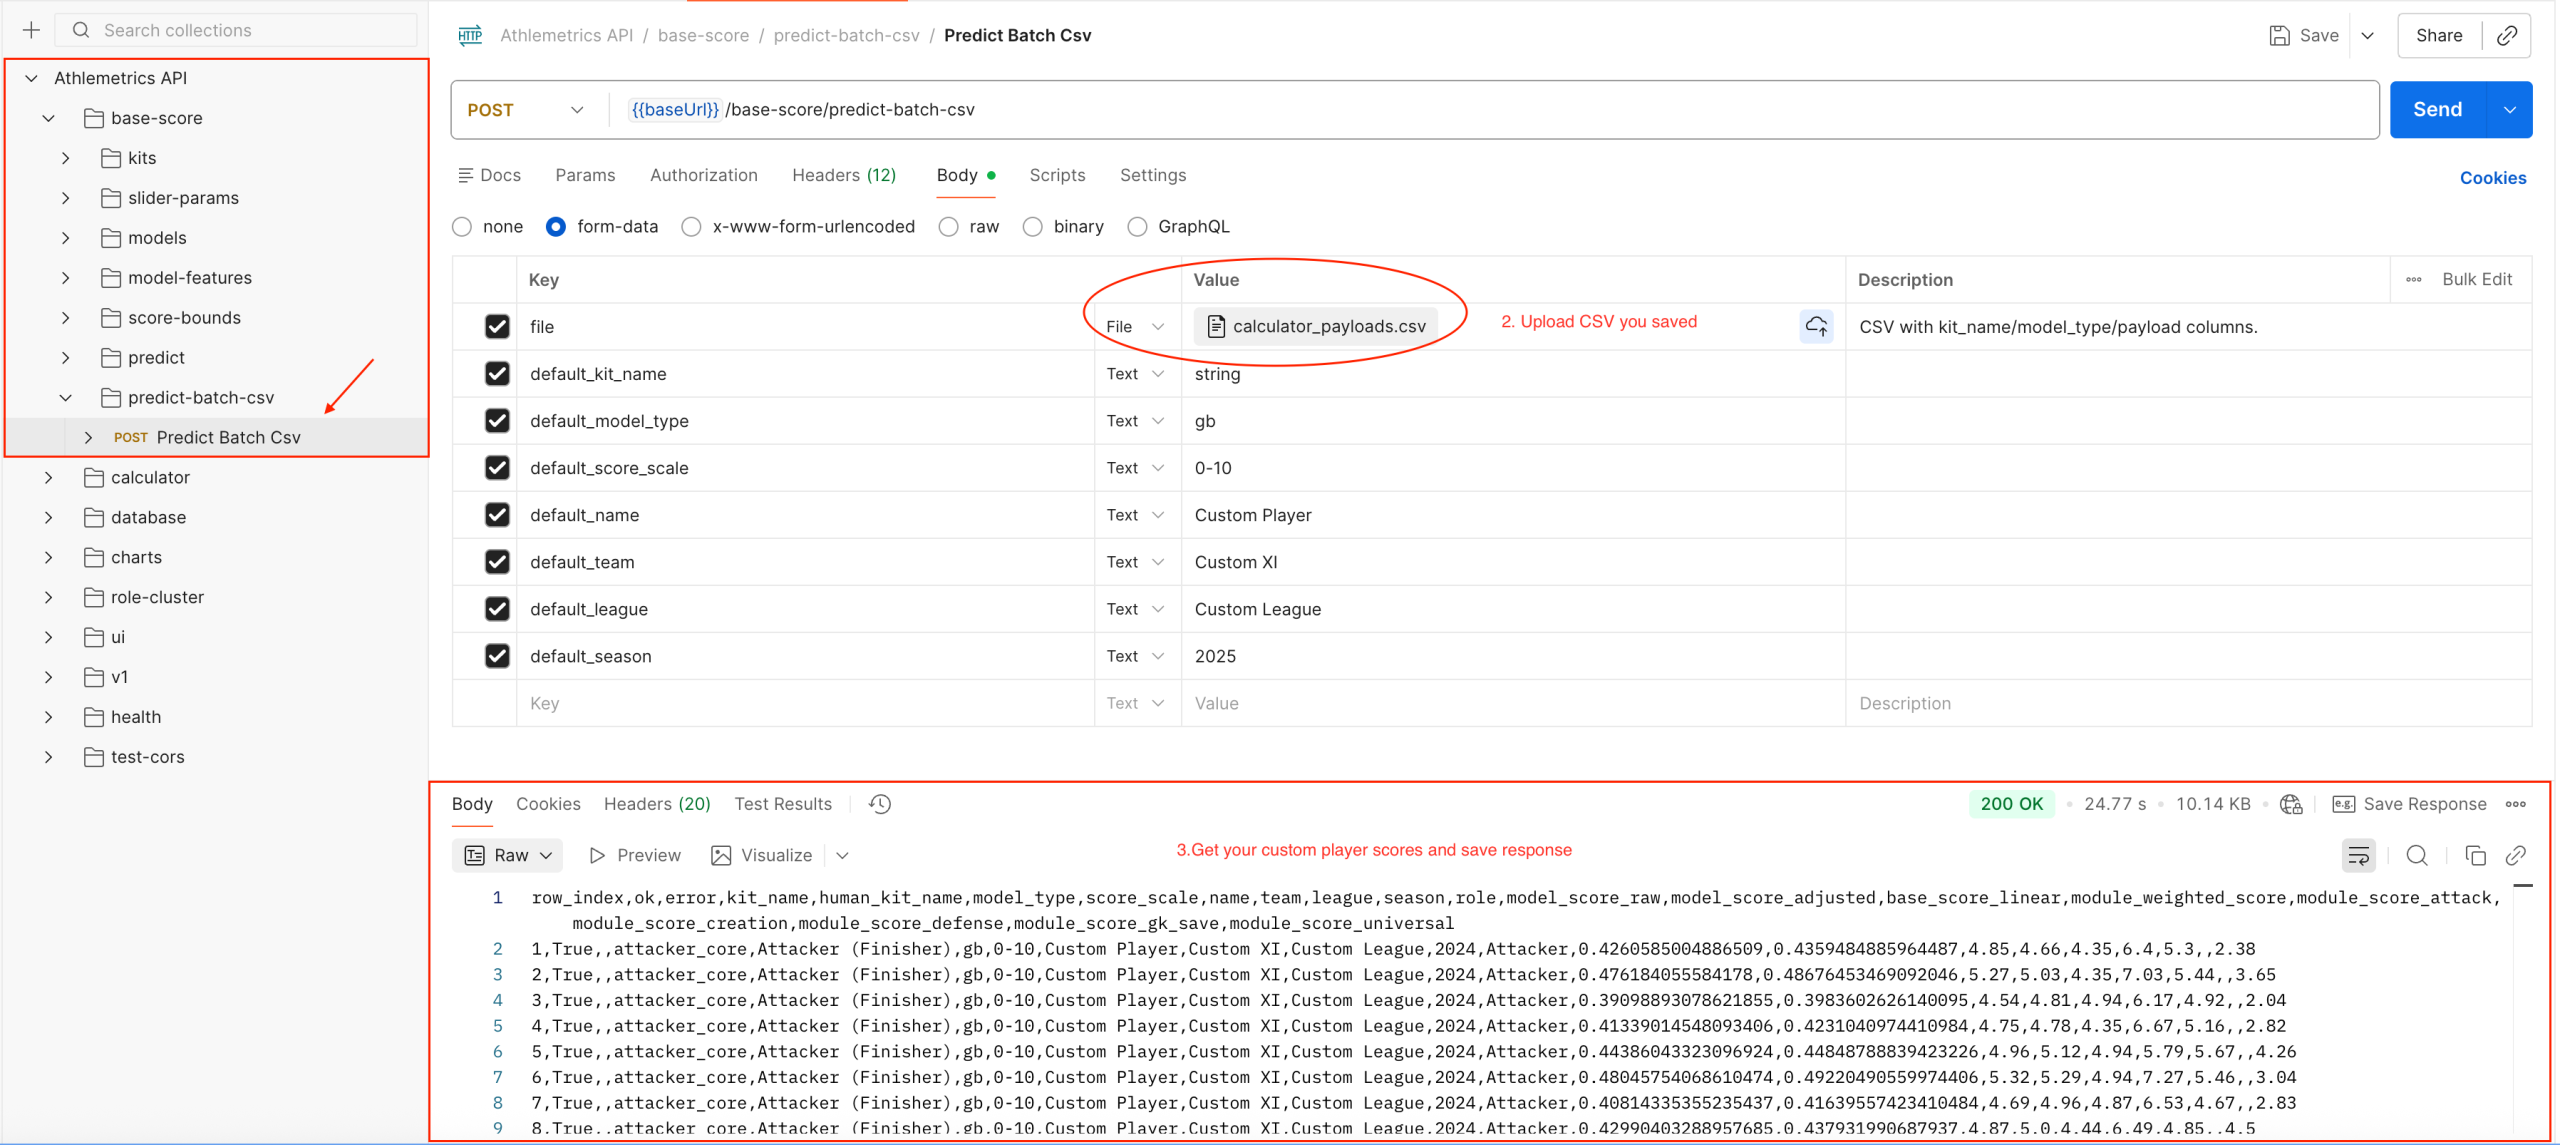
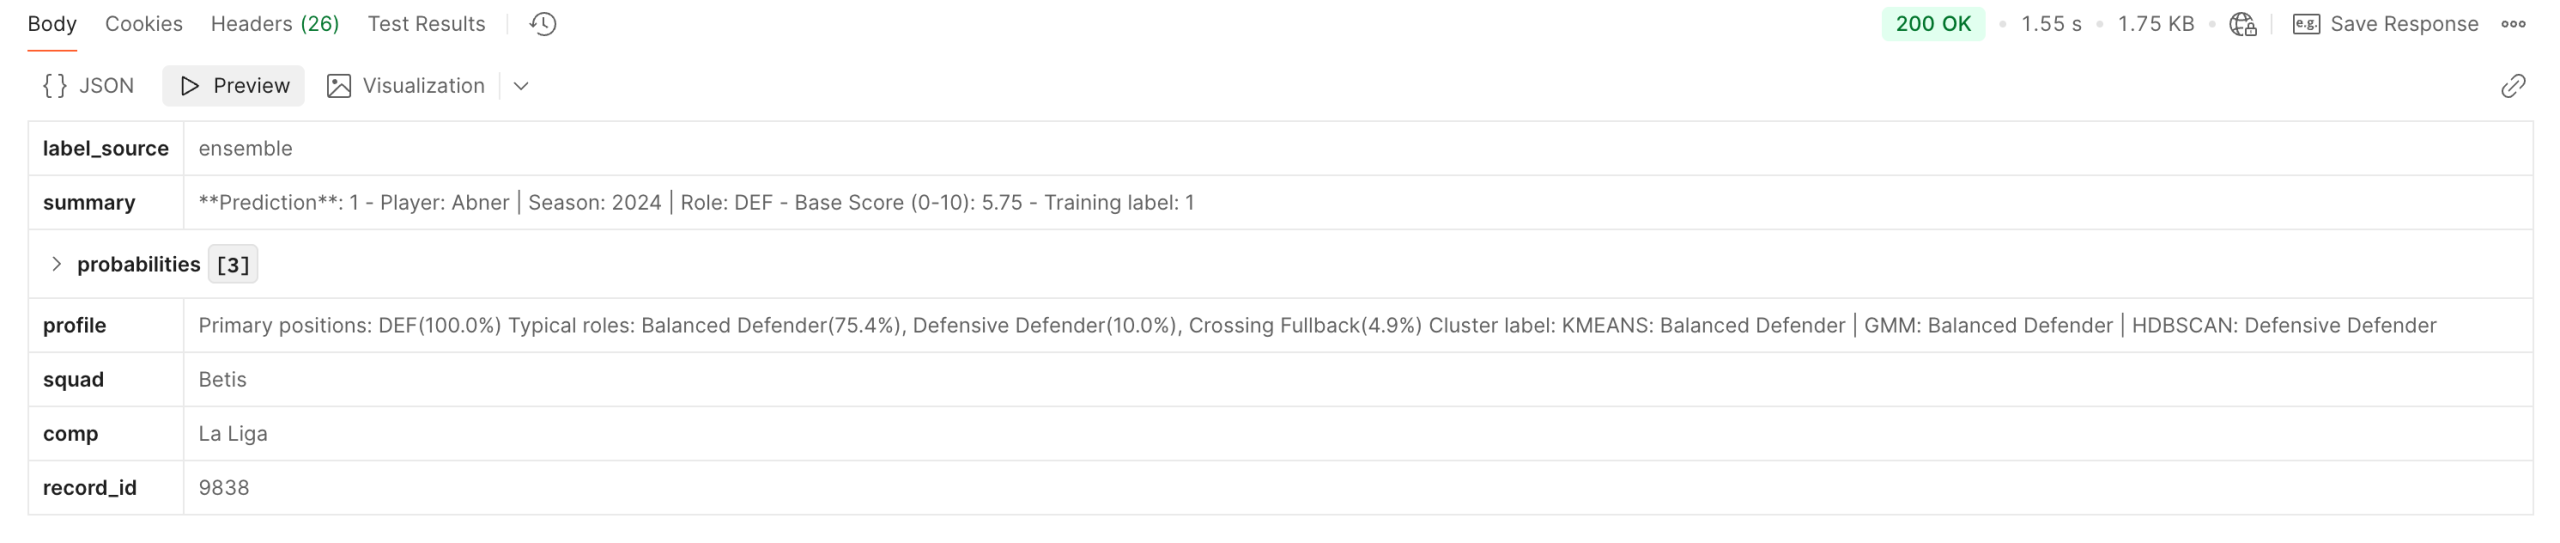
02 Athlemetrics Predictor Prediction: The Scoring Layer
Definition and Scope
Prediction is the Athlemetrics Predictor’s core scoring layer. It returns an Overall score plus multiple sub-scores, designed for side-by-side comparison within a consistent position group and scale. The important nuance: these Athlemetrics Predictor outputs are best read as a season-performance scale under stated inputs and assumptions, not an absolute measure of “true ability,” and not a direct future forecast. Used for shortlisting and tiering, it’s most valuable; treated as the only conclusion, it’s easiest to misread.
For implementation details, see the Athlemetrics API docs, and explore workflow notes in football API posts.
Athlemetrics Predictor Key Inputs and Constraints
- Comparability requires consistent definitions: minutes and stats should come from the same season, source, and statistical definition.
- Normalize before you fill: when data comes from mixed definitions, align formats with Calculator first, then score.
- Missing fields introduce uncertainty: the less complete the record, the closer the result is to an estimate under limited information.
Athlemetrics Predictor Example: Turning the Idea into One Request (Optional)
Quick Calibration with Athlemetrics Predictor
- Choose the kit that best matches the role responsibility (attacker / midfielder / defender / goalkeeper).
- Make sure definitions are consistent (especially minutes and per-90 conventions).
- Check whether the score range and sub-score structure match expectations; use it to calibrate the scale, not as a final verdict.
At Scale: Using Athlemetrics Predictor for Shortlisting
- Organize your CSV by season records (one player-season per row).
- Normalize first, then score in batch to reduce noise from inconsistent data expressions.
- Use outputs for ranking, tiering, and candidate-pool management, then apply contextual judgment.
Score outputs depend heavily on input quality. If minutes are unreliable, definitions are mixed, or too many fields are missing, treat results as an estimate under limited information rather than a final conclusion.
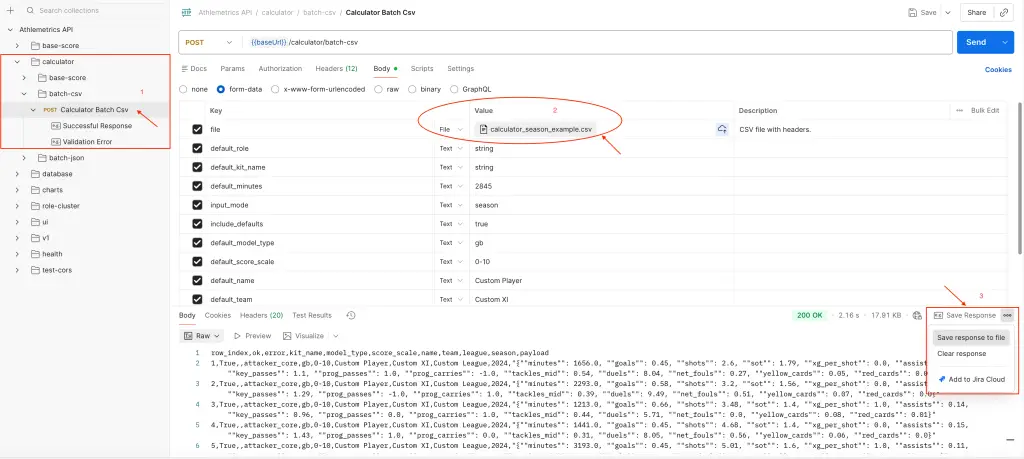
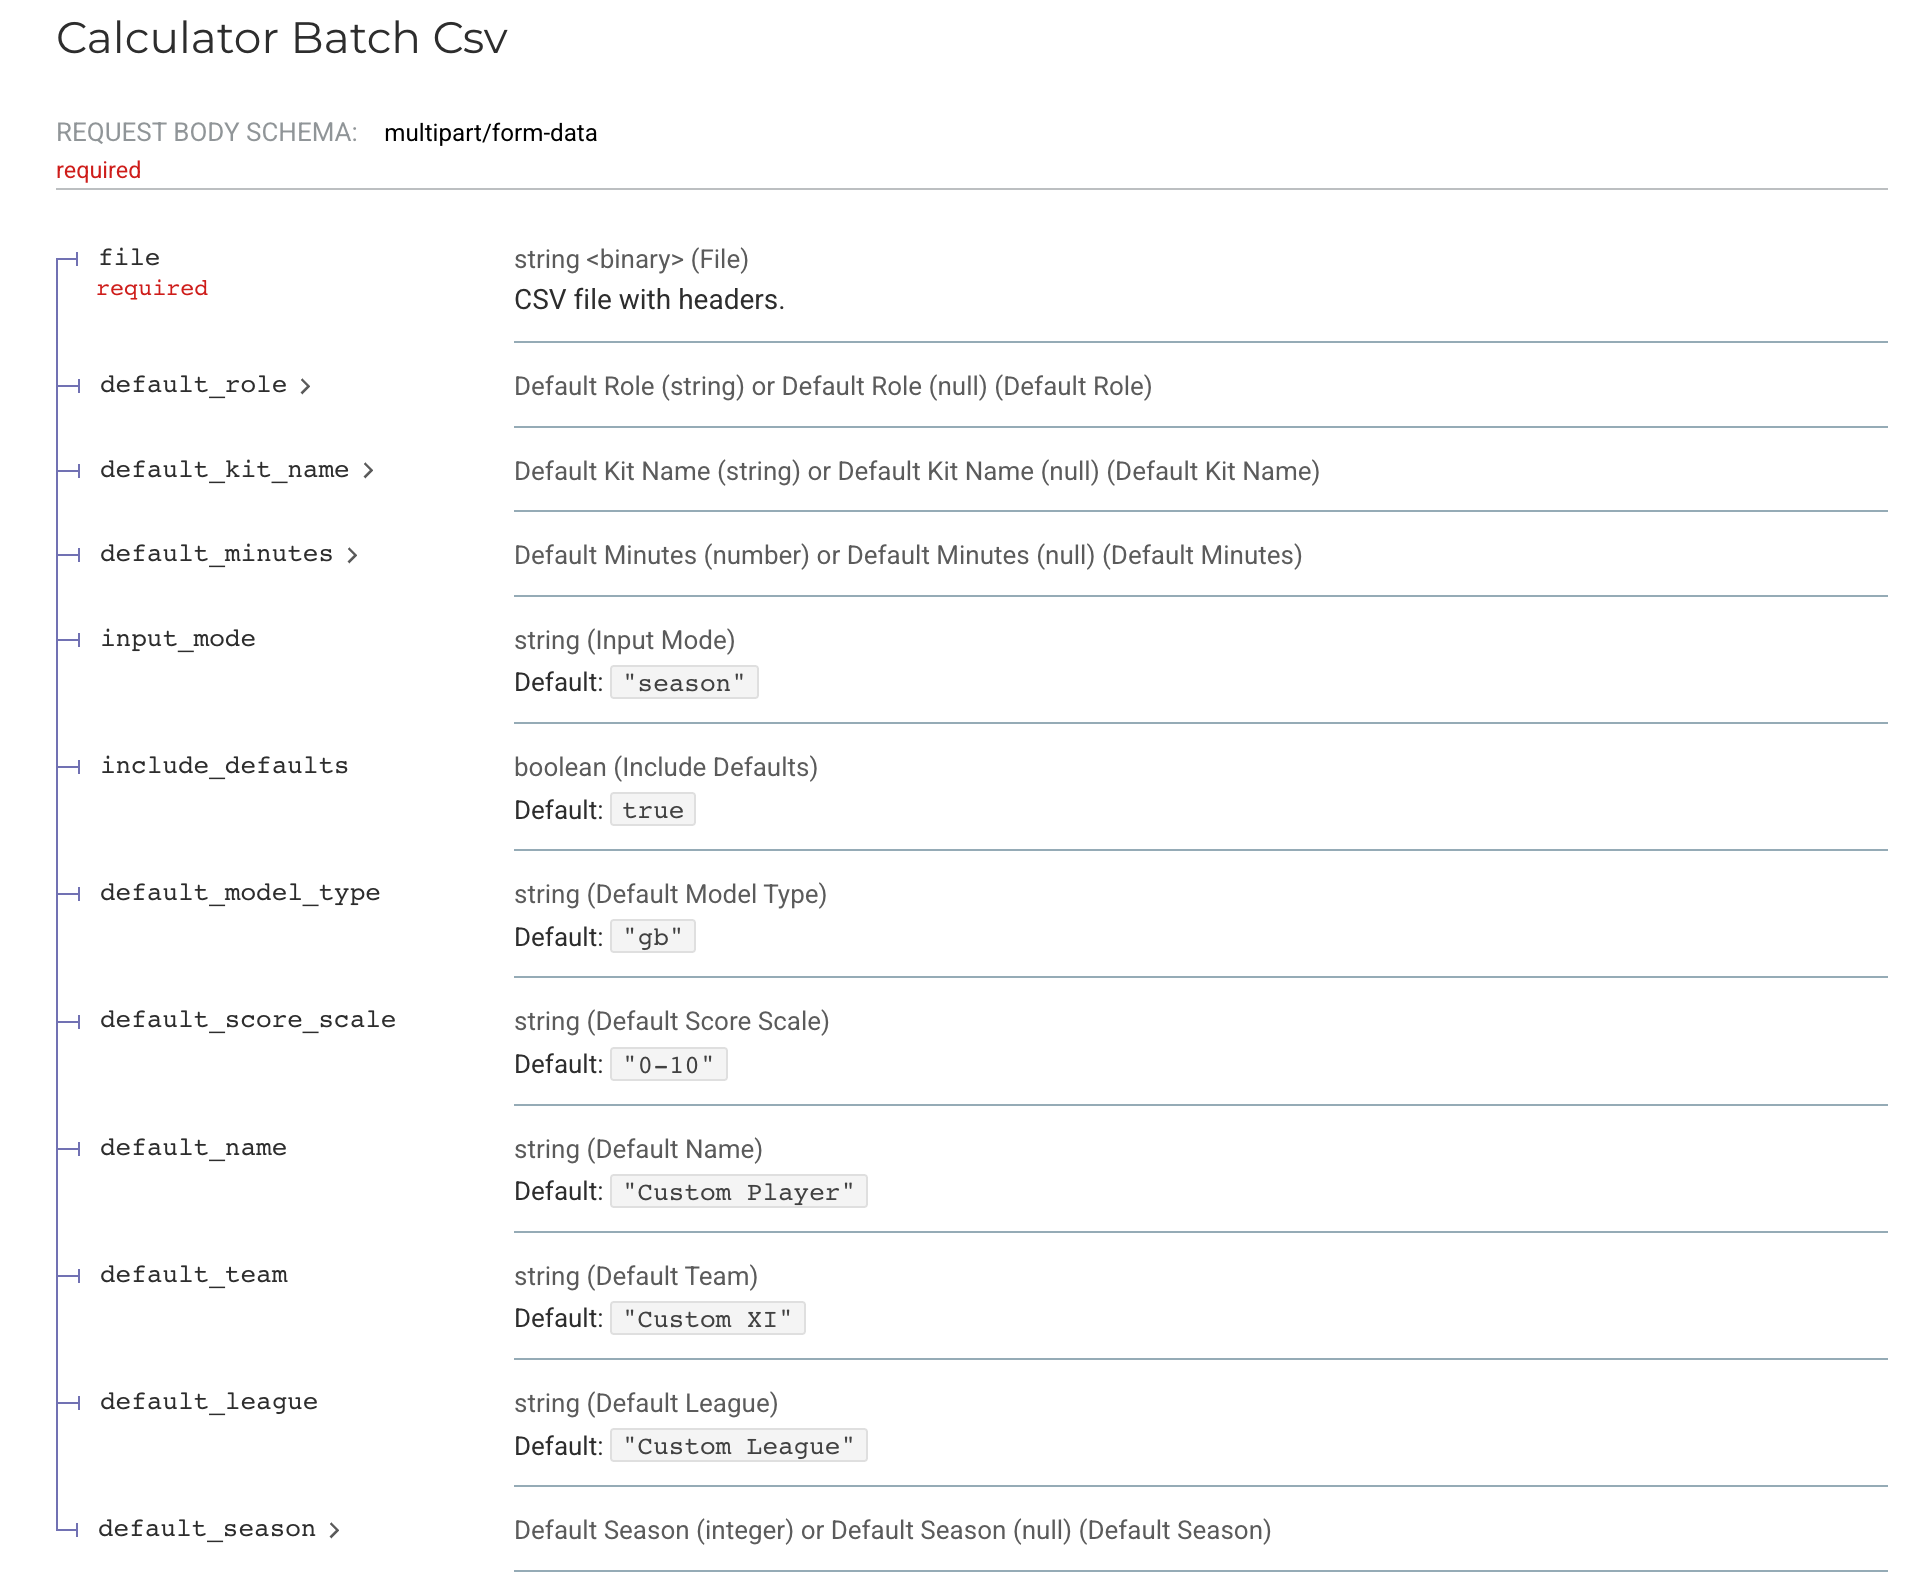
03 Athlemetrics Predictor Calculator: Preparing Data
Definition and Responsibilities
Calculator is the definition-alignment layer for the Athlemetrics Predictor. It converts “season totals / varying field formats” into standardized payloads the models can consume (often in per-90 form). This step looks basic, but it often determines whether Athlemetrics Predictor comparisons are valid. Score stability comes more from consistent inputs than from having more fields; the Calculator exists to reduce noise caused by conversion and schema differences.
- Convert season totals into per-90 payloads based on minutes played.
- Detect / parse kit names and field schemas.
- Support batch CSV/JSON conversion with a unified output structure.
Athlemetrics Predictor Typical Workflow (Brief)
Convert a Small Sample
Input: minutes plus key stats (season totals or existing per-90).
Output: a standardized payload the model can read, with consistent field structure.
Batch Conversion and QA
Input: a batch CSV or JSON file.
Output: row-level conversion results and error messages to identify problematic samples.
- It won’t “invent missing facts,” but it will standardize how your existing data is expressed.
- Consistent definitions are the prerequisite for comparable scores.
- Common conversions and structuring logic are packaged into a single interface.
- Easier to reuse in batch pipelines and team workflows.

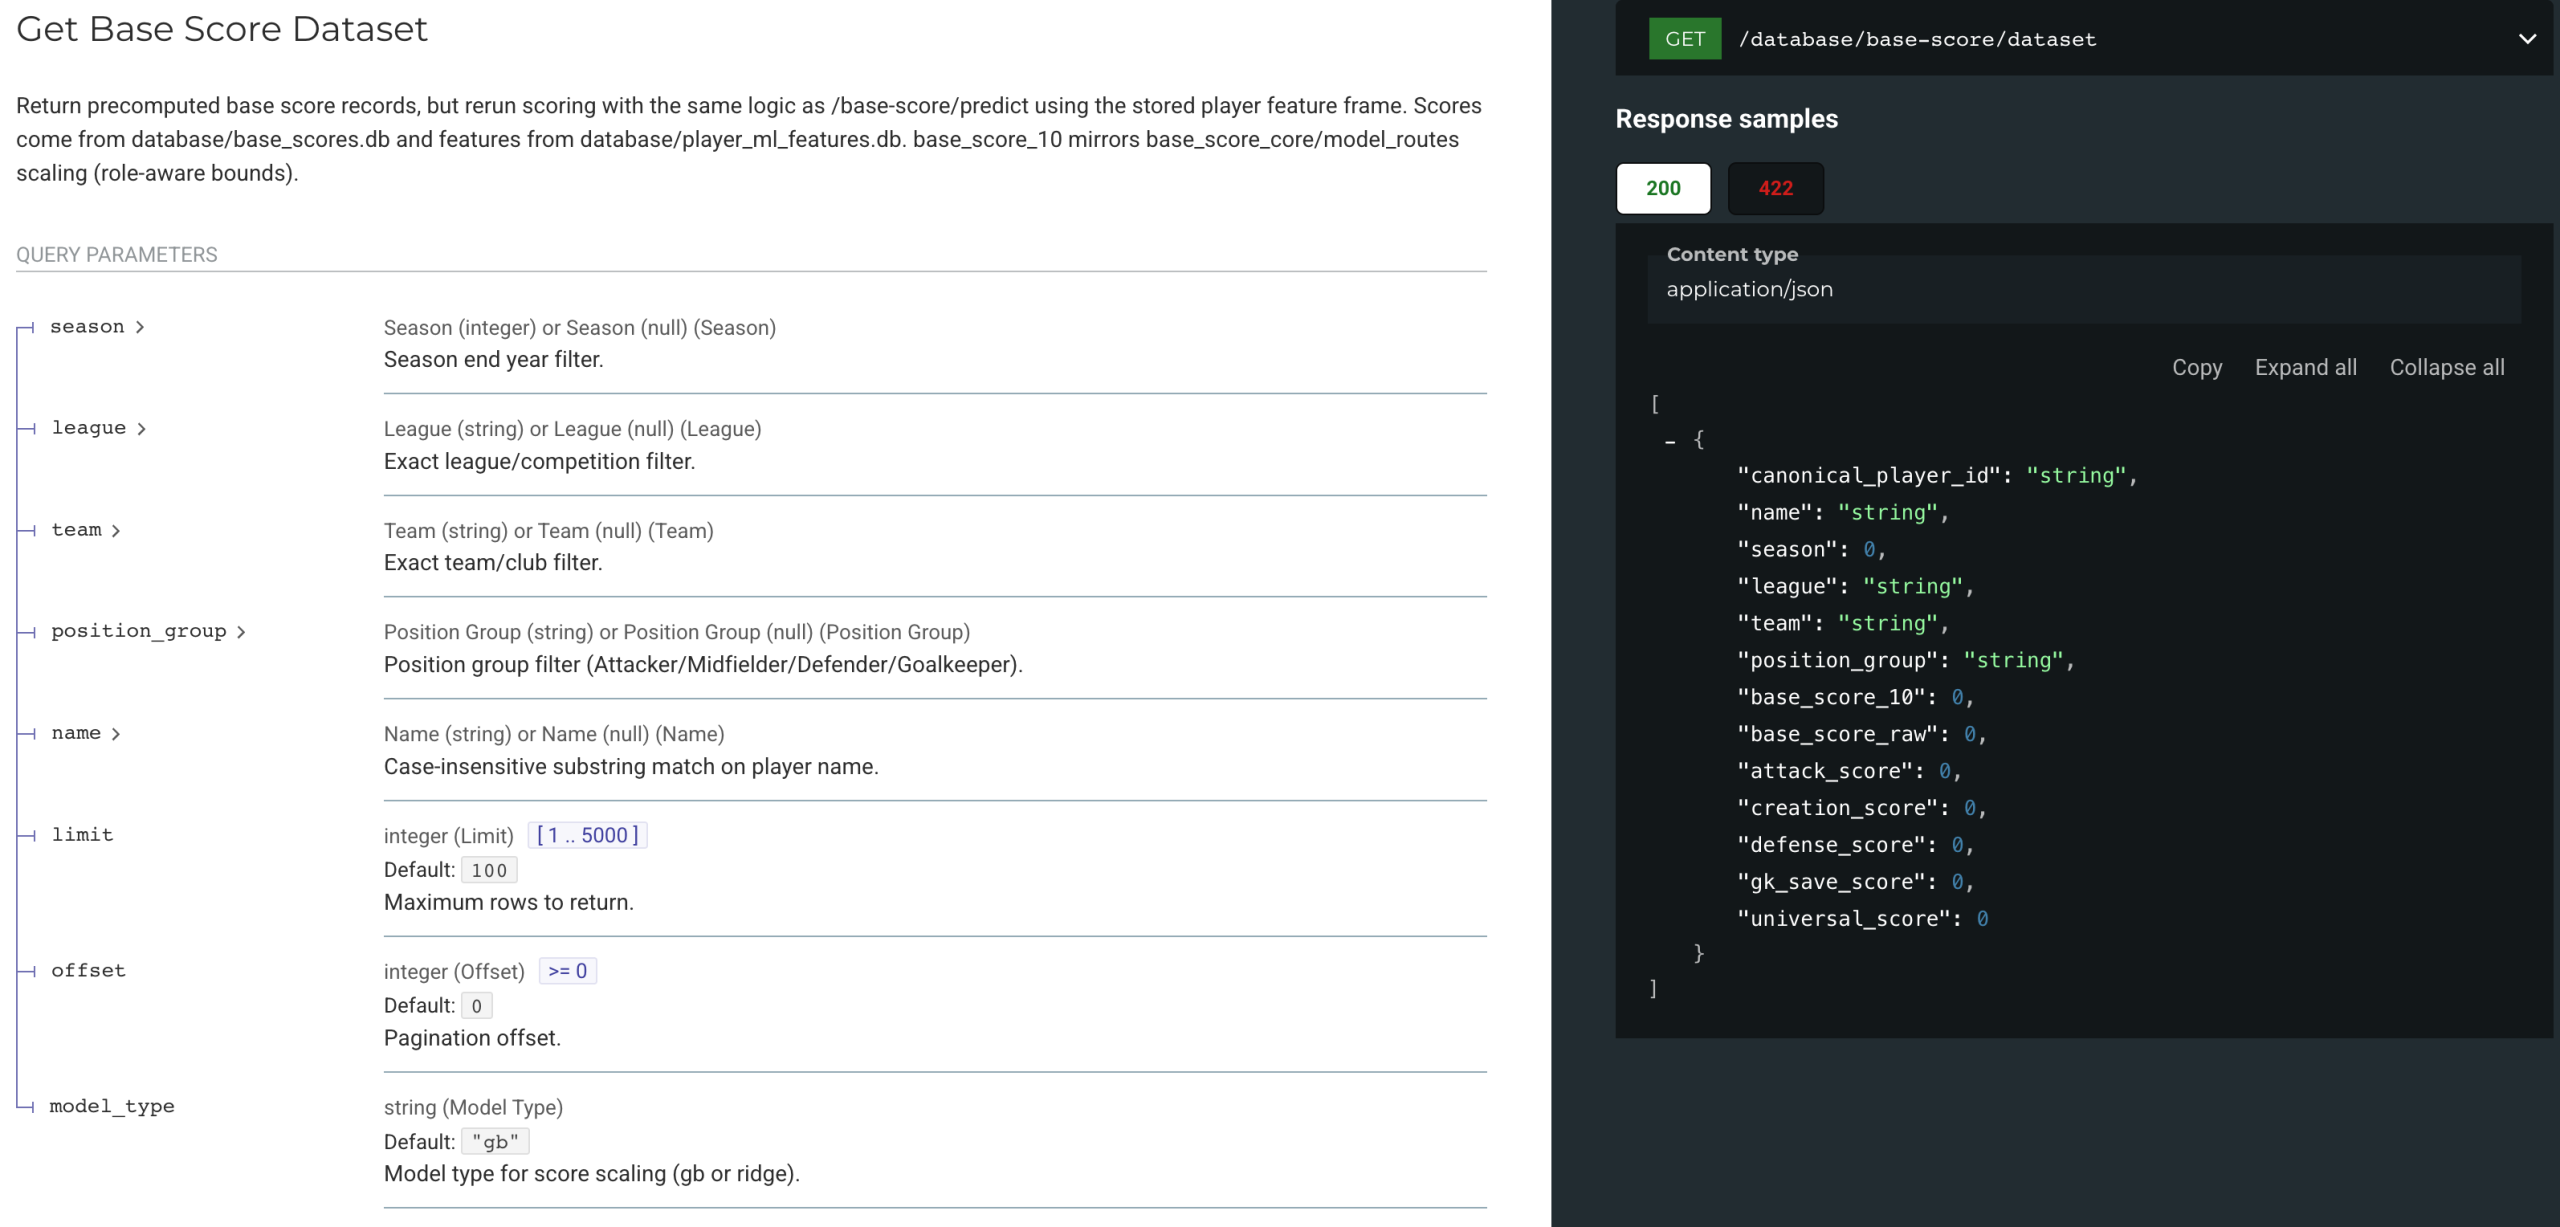
04 Athlemetrics Predictor Database: Supporting the Pipeline
Athlemetrics Predictor Database: Who It’s For and When to Use It
- Fans / media: quickly view ready-made scores and season data.
- Scouts / analysts: start with stored data for a first pass, then decide whether to upload custom data.
- Developers: integrate ready-made data into apps or pages.
Athlemetrics Predictor Database Conceptual Usage (No API Details)
Identity Resolution: canonical_player_id
Resolve identity using name/league/team fields and establish a stable lookup key.
Filter by Season
Filter scores and per-90 datasets by season / league / team.
Hand Off to Deliverables
Use canonical_player_id as a stable lookup key, then generate readable pages or shareable views via Report/UI.
05 Athlemetrics Predictor Player Role: Enhancing Analysis
Athlemetrics Predictor Role Positioning and Definition
Position labels rarely capture responsibilities. Player Role adds structured playstyle/role interpretation on top of scoring, enabling similar-player lookup, comparisons, and difference explanations—forming a “strength + type” view together with scores.
Athlemetrics Predictor Role Inference Paths (No API Details)
- From stored records: look up a player record first, then infer the role for that record.
- From custom features: submit a normalized feature payload to get role tendencies.
Role capability is available for some players / some datasets. Coverage depends on the actual response. Role outputs are best used as decision support and for similar-player lookup, not as a standalone final verdict.
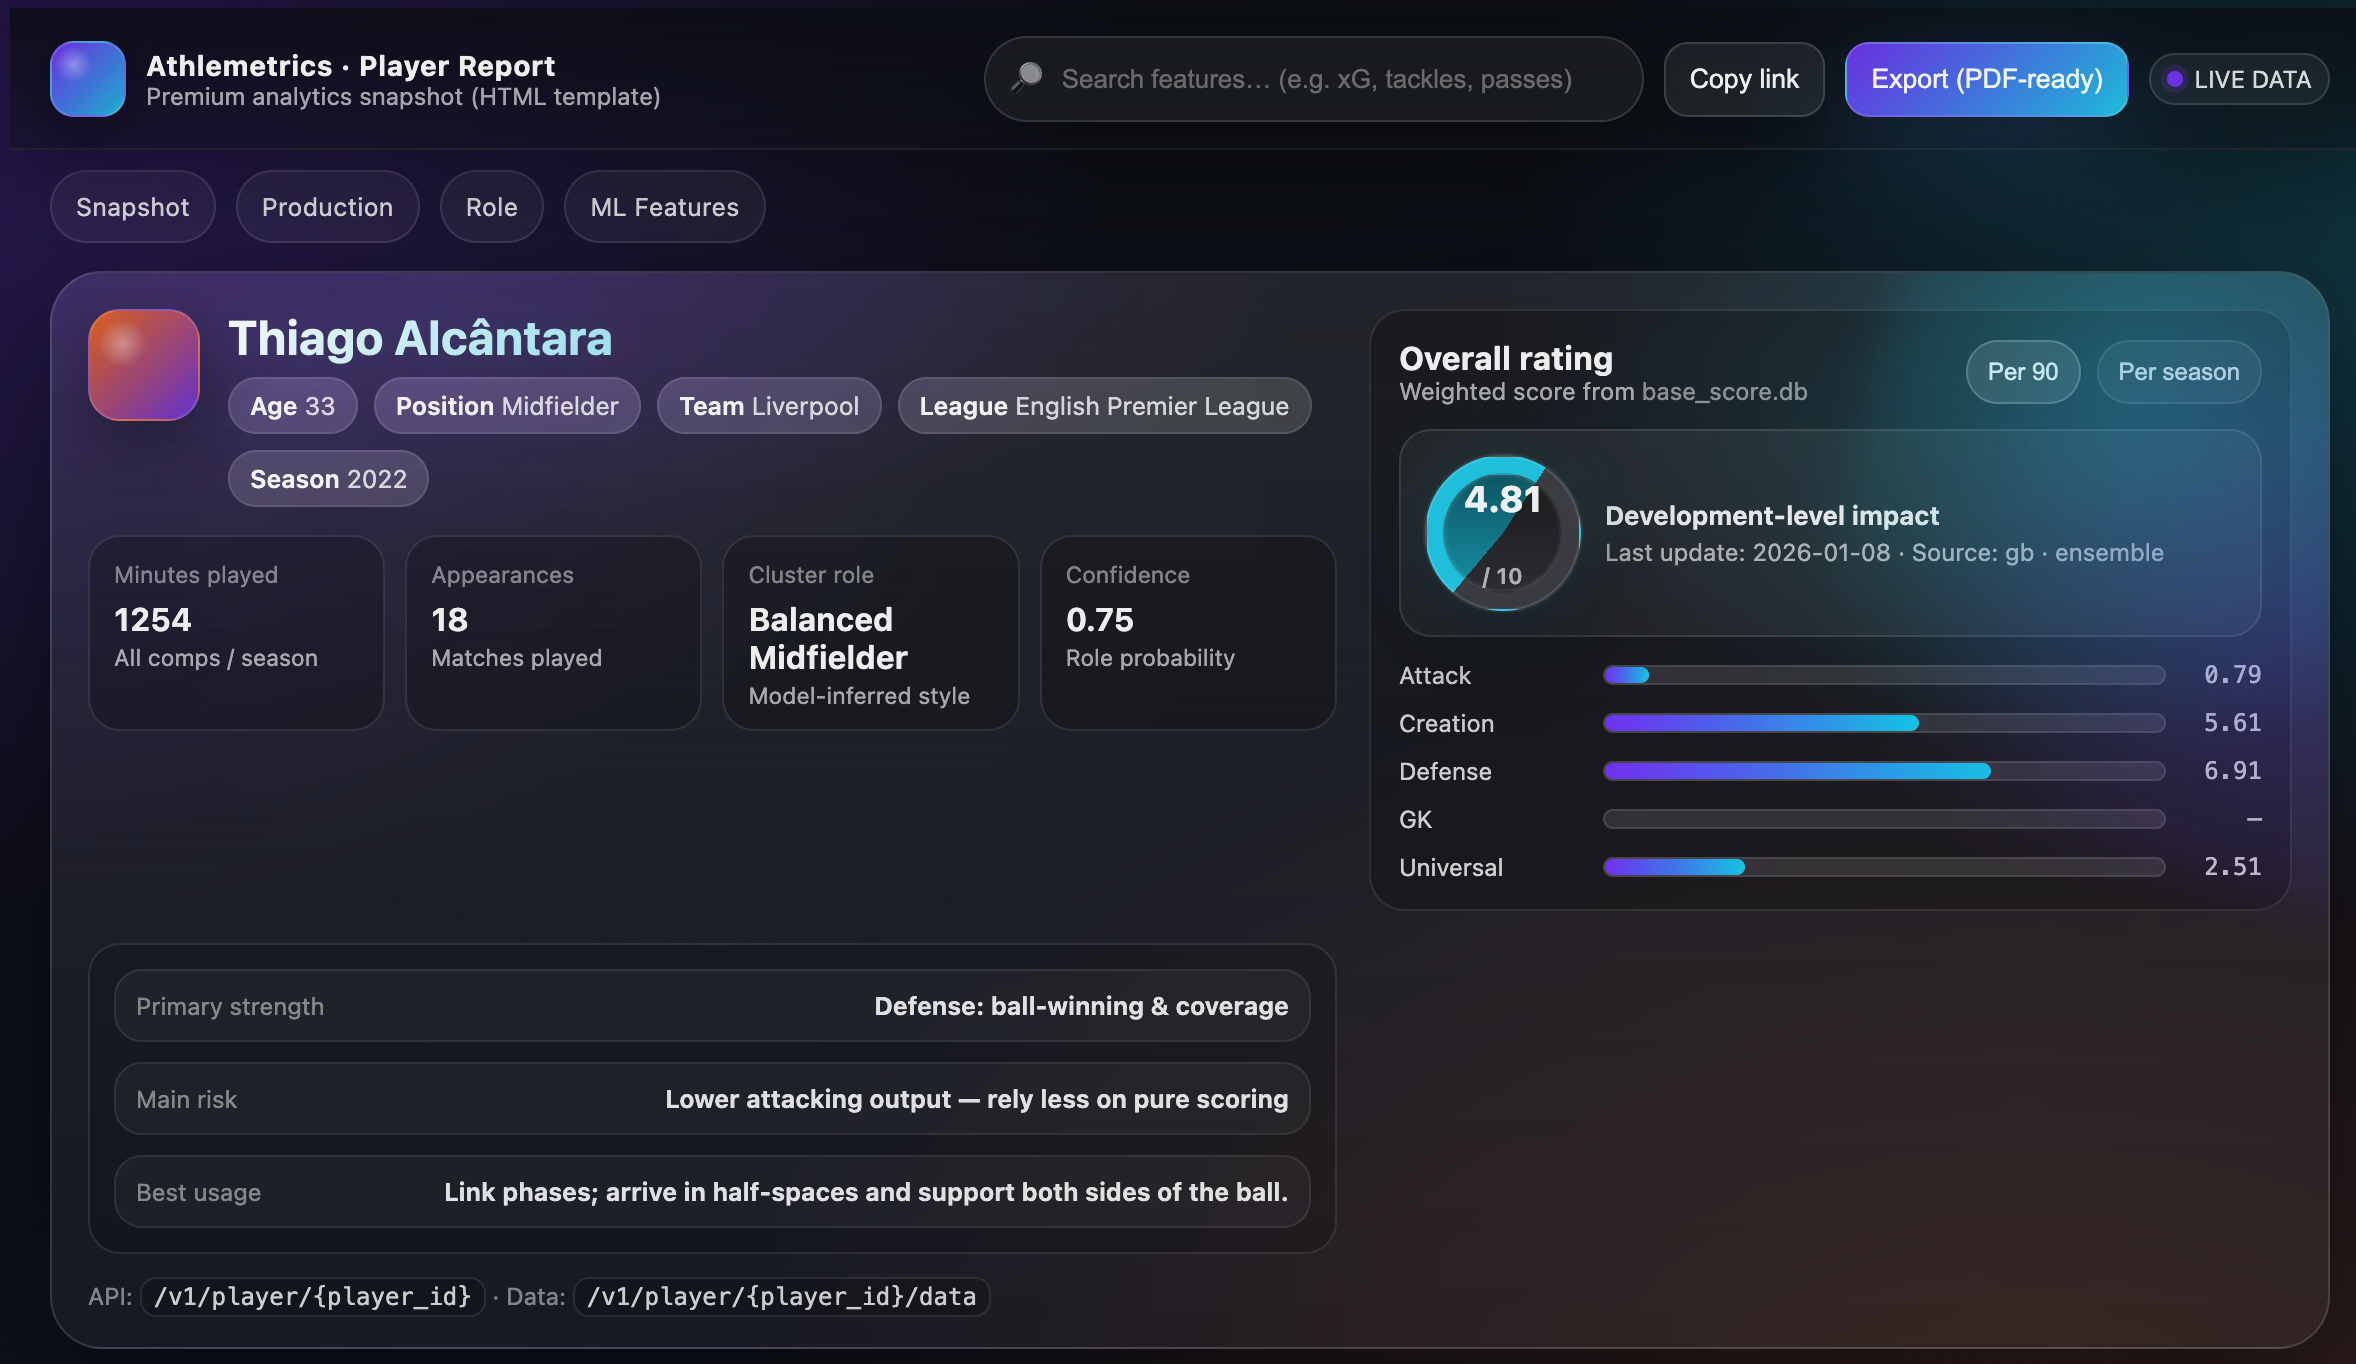
06 Athlemetrics Predictor UI / Premium Report: Visualizing Results
Athlemetrics Predictor Report Definition and Value
The report page is the reader-facing layer: it brings together basic info, scores (including sub-scores), per-90 data, and key features—and adds role information when available. For teams, the report also acts as a stable display template and data contract.
Athlemetrics Predictor Two Common Deliverables
- Interactive report page (UI Report Dashboard): built for reading and sharing, turning scores, sub-scores, and key stats into a visual narrative.
- Report snapshot (HTML/JSON): built for reuse and archiving—embed in internal systems, generate PDFs, or keep versioned records.
07 Choose the Shortest Path to Athlemetrics Predictor Results
To lower the “where do I start?” cost with the Athlemetrics Predictor, pick the shortest path by goal: normalize and score for custom evaluation; or start with Database and reporting for quick, ready-made views.
1) Evaluate Custom Player / Season Data with Athlemetrics Predictor
Recommended path: Calculator → Prediction → (Optional) Report
- Calculator: align minutes and per-90 definitions.
- Prediction: score outputs for ranking and first-pass shortlisting.
- Report (optional): for internal/external presentation.
2) Look Up Ready-Made Data for Stored Players
Recommended path: Database → UI/Report
- Database: resolve player identity first, then fetch by season/league/team.
- UI/Report: present key information in one place.
3) Add Player Type / Playstyle Profile with Athlemetrics Predictor
Recommended path: Database or Prediction → Player Role → (Optional) Report
- Start with player basics and scores.
- Use Player Role to add role/playstyle interpretation.
- When you need deliverables, summarize via Report.
4) Athlemetrics Predictor Enterprise / Product Integration: Embeddable and Reusable
Recommended path: Database (structured data) or Premium Report (HTML/JSON snapshot)
- For data ingestion and secondary development: prioritize Database.
- For quickly generating readable pages: prioritize Report / Premium Report.
5) Athlemetrics Predictor Integration Workflow Overview (RapidAPI → Postman)
Client Setup
Store the API key in headers or environment variables for easier management. Many teams use Postman to keep environments organized.
Build a Reusable Workflow
- Easier to explore and debug Prediction/Calculator/Database/Role/Report.
- Better for batch tasks (e.g., CSV upload and batch conversion).
- Easy to share within teams (Postman Collections + environments).
If your goal is “quick trial + a stable workflow,” a common setup is: RapidAPI for subscription and key management, and Postman for interaction and batch operations. It’s lower friction and easier to learn.
08 Athlemetrics Predictor Closing: Keeping Results Comparable and Interpretable
- Solve “same scale” before “higher/lower”: compare within the same position group and similar minutes to avoid cross-group misreads.
- Treat consistent definitions as the default bar: normalize custom data via Calculator before scoring.
- Use scores for shortlisting and signals: start with ranking/tiering/side-by-side comparisons, then apply match context and observation.
- Use reports when you need deliverables: UI/Report is the bridge from structured outputs to readable conclusions.